Open the full PDF report (Larsson Line Pro)
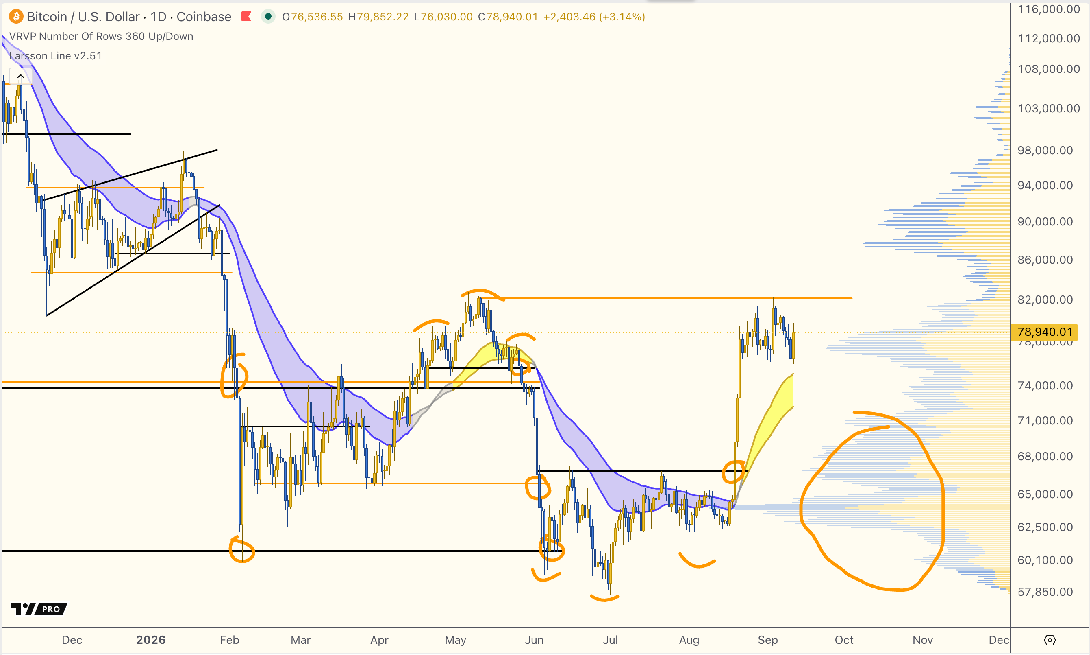
Bitcoin
- Retested & Rejected
- If we first look at the TA: The support level around 81-82k - that we have discussed over the past few weeks - broke, retested from below and rejected yesterday. You can see it clearly in this chart.
- Then the reason for yesterday's rejection. Oh boy. This Binance hack is the biggest theft in human history, by a factor 4. The previous "record" was held by another crypto exchange hack, that time it was ByBit.
- There have been too many security incidents lately, related to both hardware wallets and exchanges. That is not good for the confidence of the crypto ecosystem. One random devops engineer's laptop gets compromised plus some events and thieves get away with billions of dollars. And it keeps happening. Unacceptable. Culture of speed and handling will need to change, or there will be a serious confidence drop.
- How this affects price short-medium term I don't know.
- It's obviously not good when one of the biggest players in the entire ecosystem gets a massive hack. The only positive is if they (as they have written) can indeed cover the entire loss from their SAFU fund and company funds, similar to what ByBit did. That would be very different from when FTX, Celsius, Luna etc collapsed which spread into the broader ecosysystem through lending, leverage and agreements. Still. Not good. Not the positive momentum we want to see.
- As you see below in the position disclosure updates, I closed some altcoin positions yesterday. I reduced a little in Bitcoin but not enough to be a "materially reduced" update. I'm fine to buy that back at higher price if risk drops and market finds strength.
- Could it be the "final flush"? Like someone wrote on X yesterday "no bottom until there has a major exchange hack". Of course possible. Who knows. I will simply, as always, try to react.
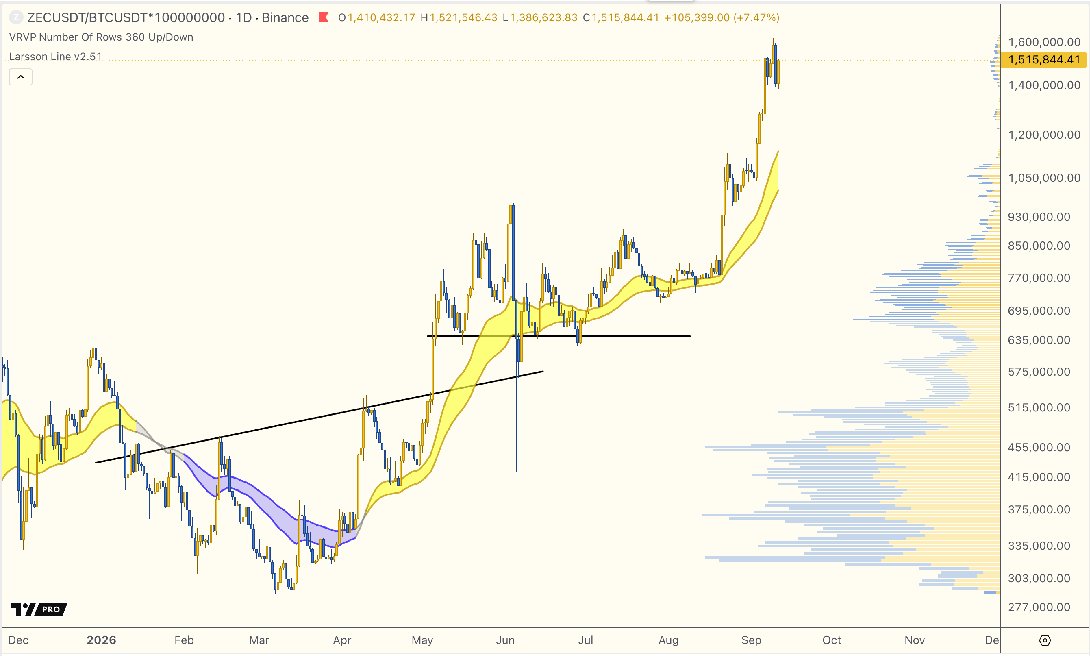
Zcash
ZEC was notably not particularly affected by the carnage yesterday. The bounce in ZEC/BTC off the 0.014 B level has held well. The trend is still double gold.
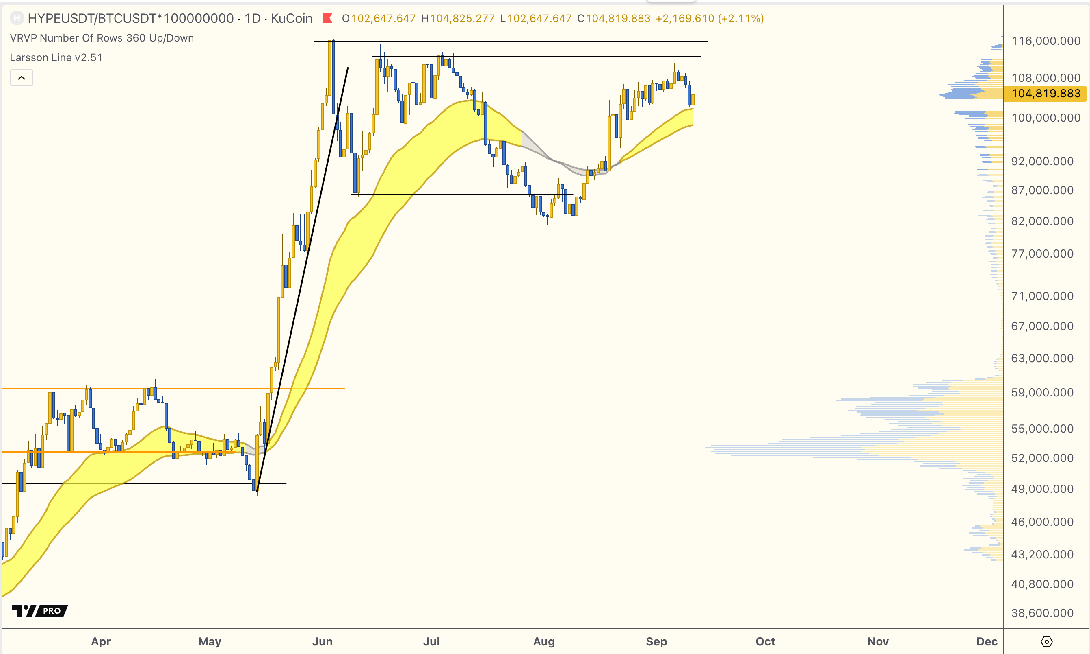
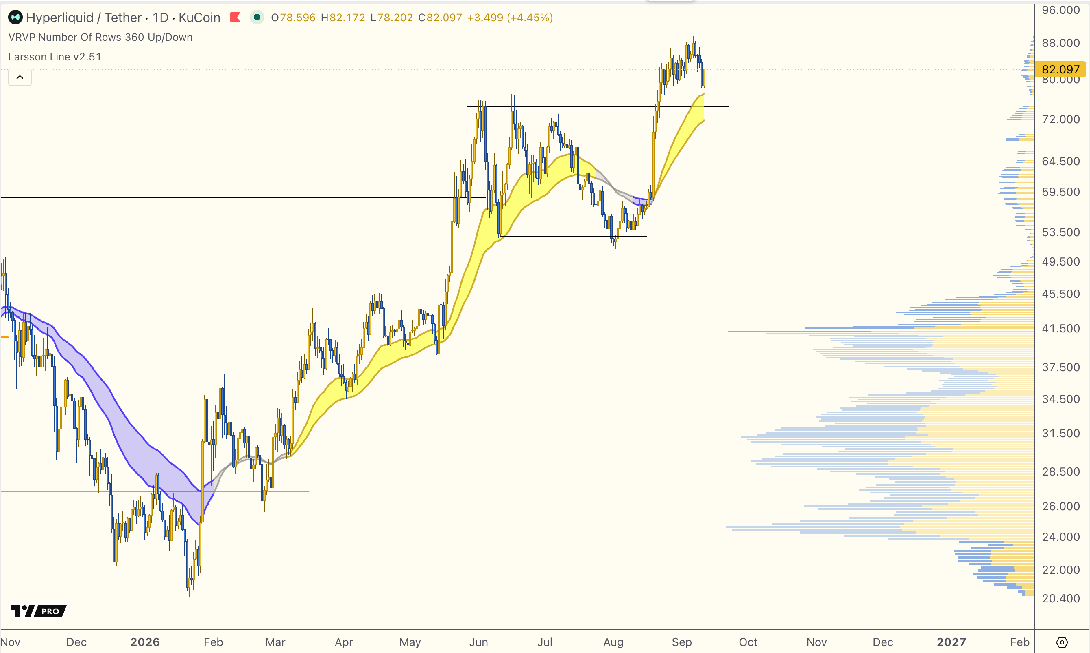
HYPE
Ok this is interesting. Last week HYPE/USD is was retesting the breakout level. It held as support. Then yesterday when almost the entire market mega dumped, HYPE pumped, not only on HYPE/BTC but on HYPE/USD as well. HYPE/BTC had a massive up-candle yesterday. I'm actually not sure of the reason. First I speculated that it was because the confidence in CEXs dropped, but then I saw that Uniswap dumped too. Here it looks like HYPE/BTC is even trying to break out.
NEAR
I discussed last week the numerous times that this chart rejected at resistance. Price eventually gave way. I closed my position yesterday (see position disclosure update below). Position Disclosure Update: CTO LONG CLOSED 2026-10-29
Ondo
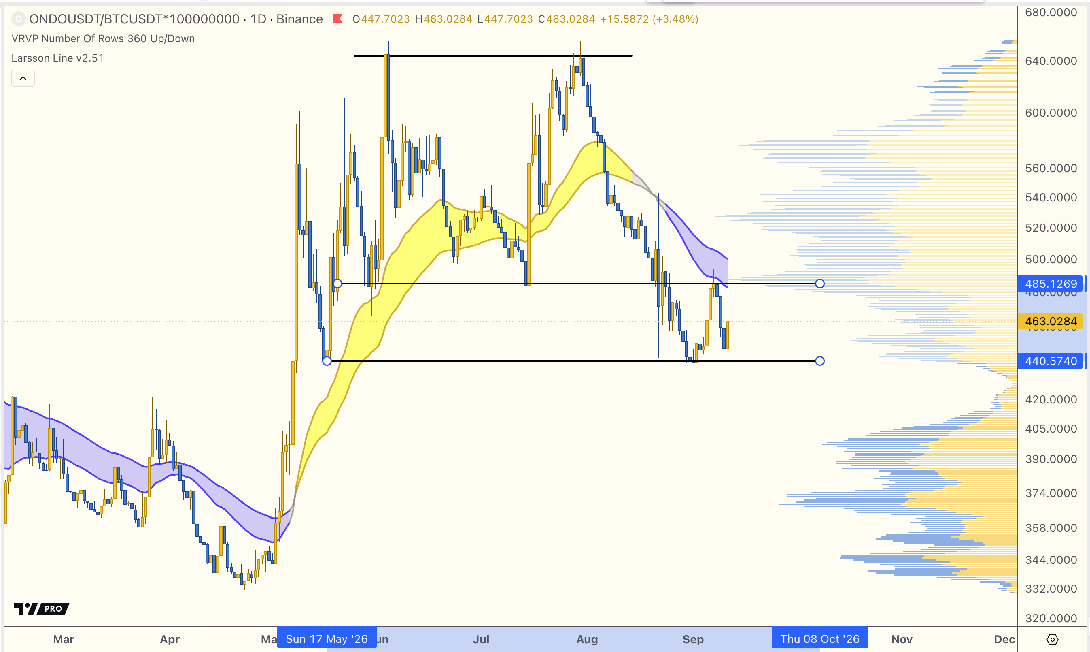
ONDO/USD is not a good look but ONDO/BTC is still ranging. I have a very small position only.
Solana
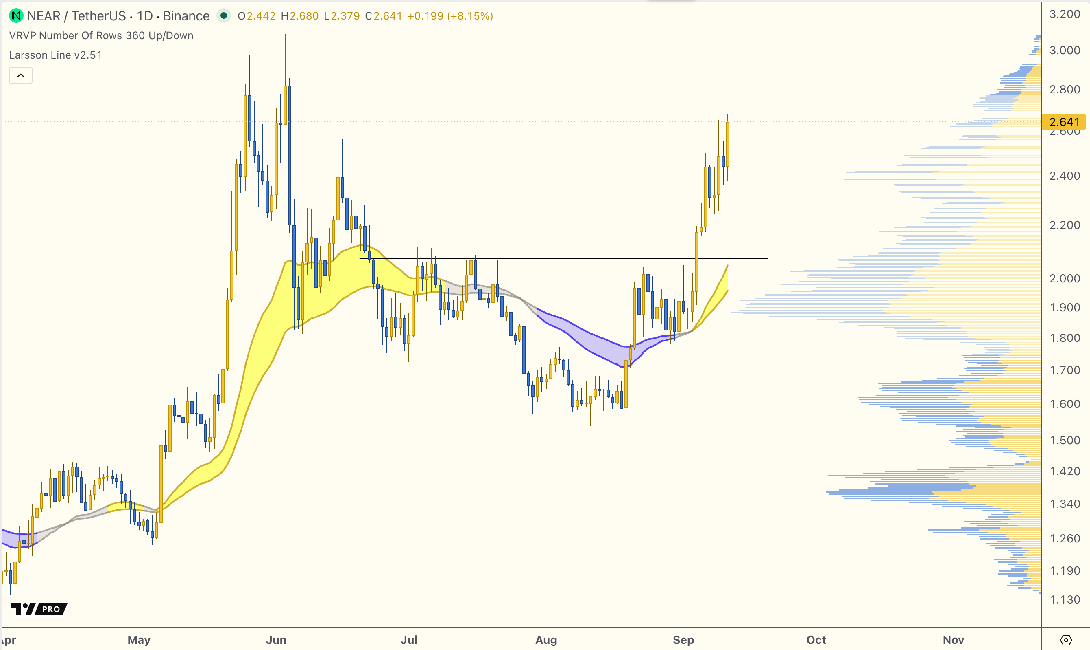
Unless Solana almost immediately recovers here, this is a breakdown. Not happy. SOL/BTC also remains rejected at 138 ksats.
Ethereum
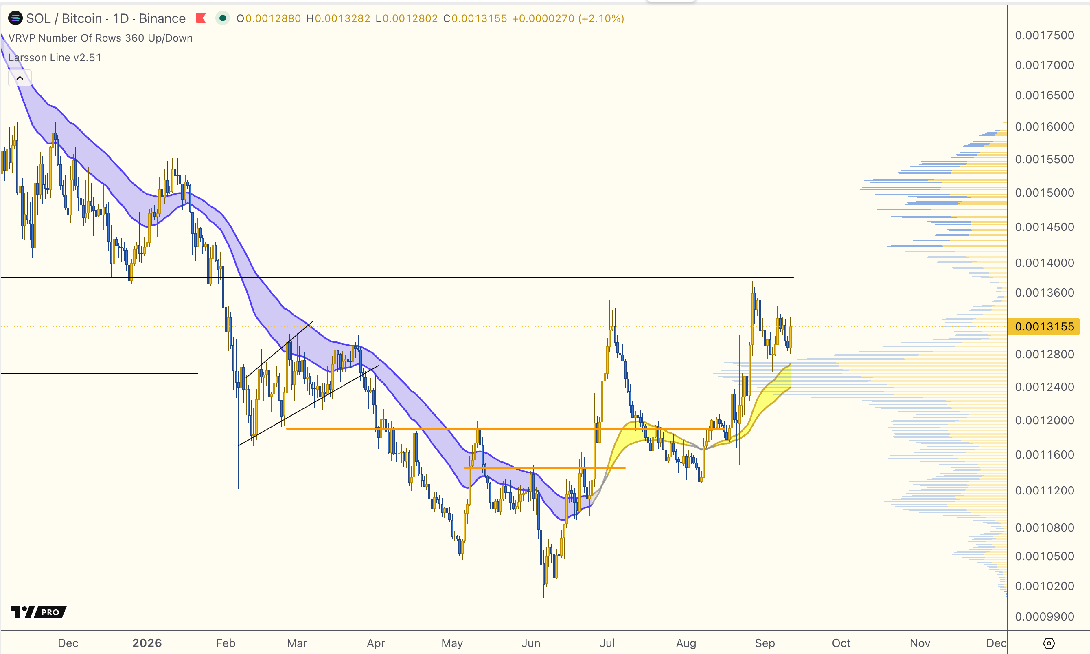
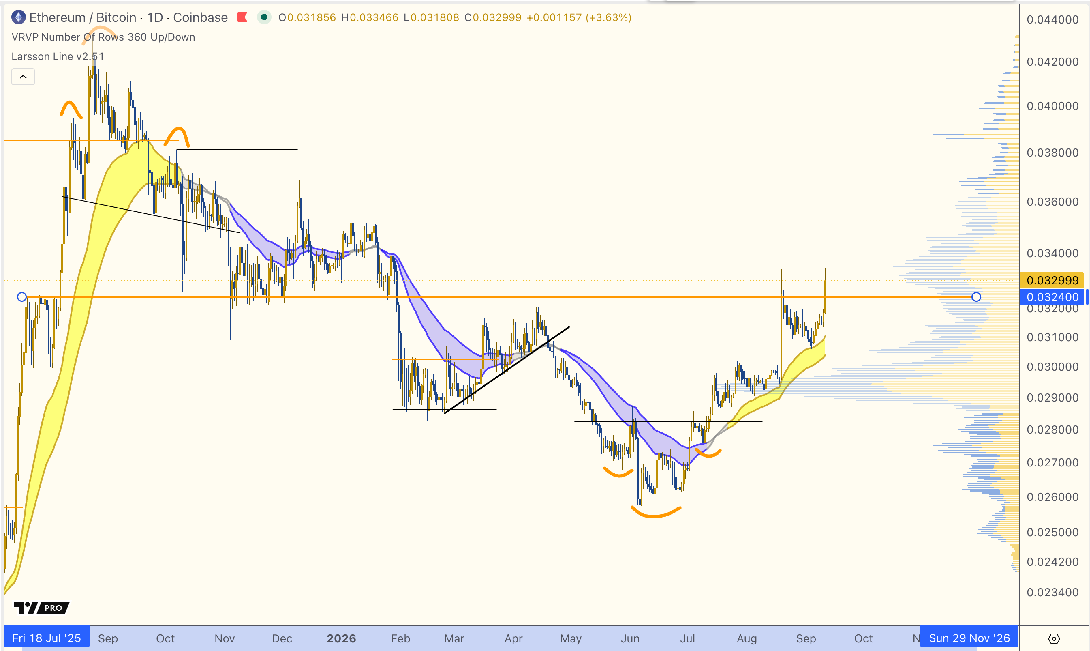
Ethereum couldn't hold its support. The "hack candle" yesterday became a retest from below which rejected, almost exactly the same chart structure as Bitcoin. That was the nail in the coffin of this chart. I closed my position (see below). If the market structure changes and it reclaims support, I'm fine to buy back at higher prices but lower risk. Position Disclosure Update: CTO LONG CLOSED 2026-10-29
BNB
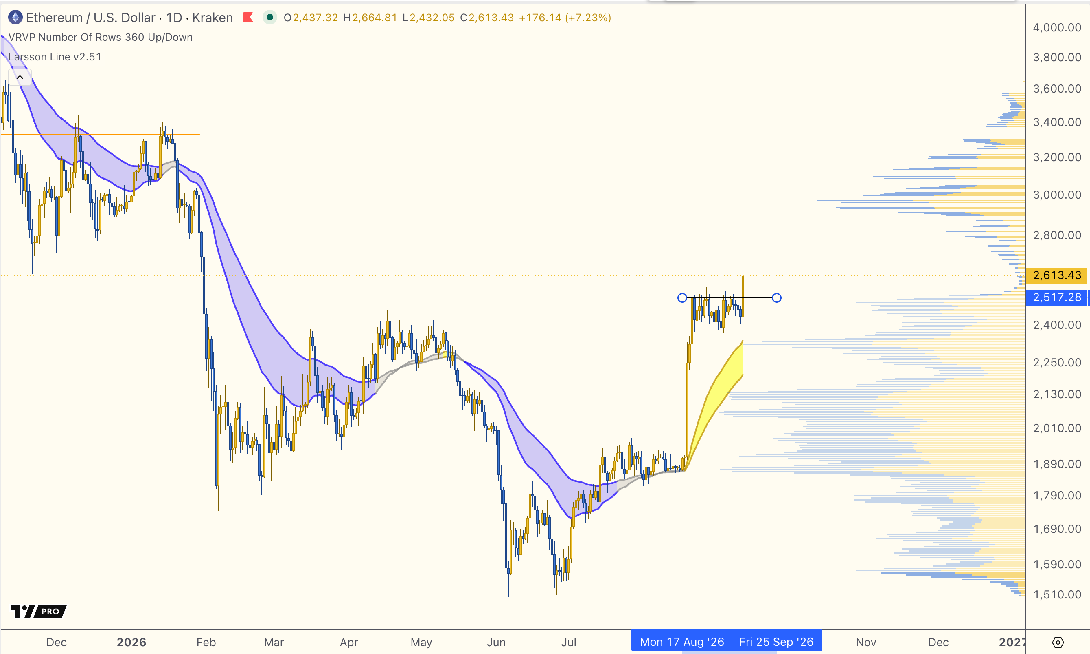
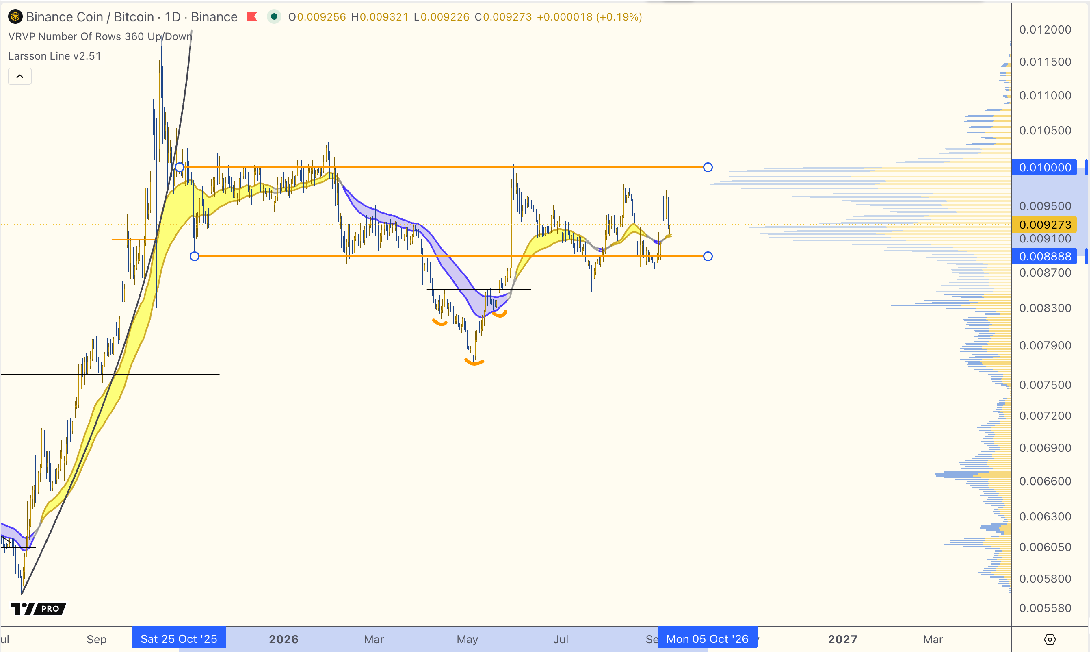
The BNB/BTC chart held up surprisingly well considering the situation and didn't actually break support. If we hadn't gotten any breakdown in Binance after the biggest heist in human
Uniswap
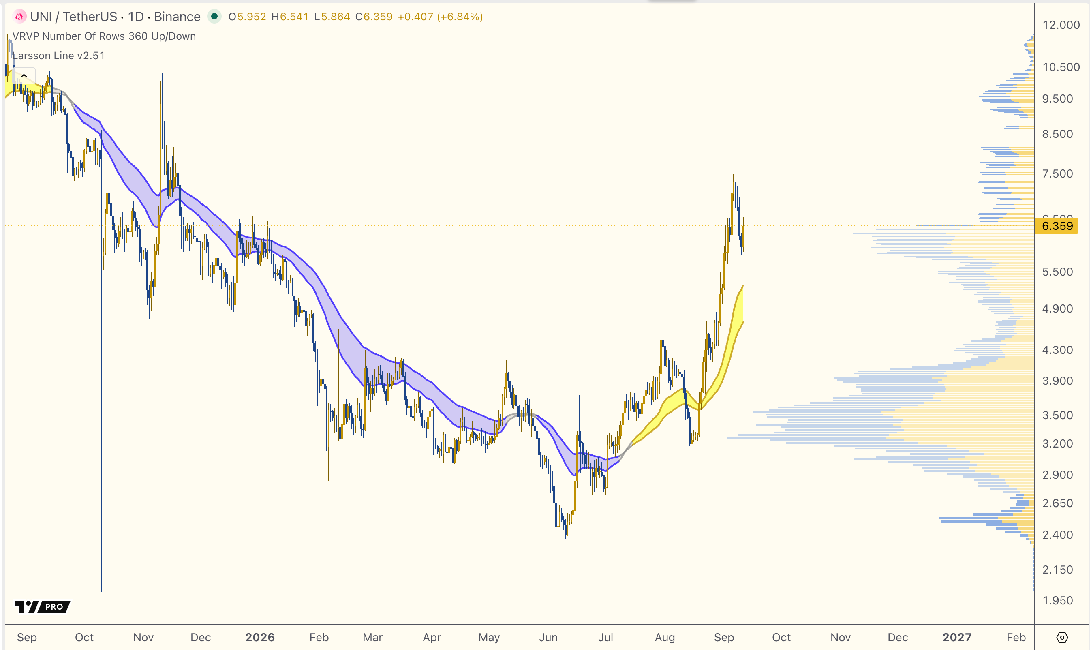
Uni didn't get the huge up-candle that HYPE got yesterday. But it hasn't mega dumped either, though it still feels looks like a parabola break to me. The original breakout is still holding. UNI / BTC Breakout at 5.07 ks confirmed on 2026-07-02 daily close In USD terms, price closed at $3.18 that day. Main DEX and liquidity layer on Ethereum
PYTH
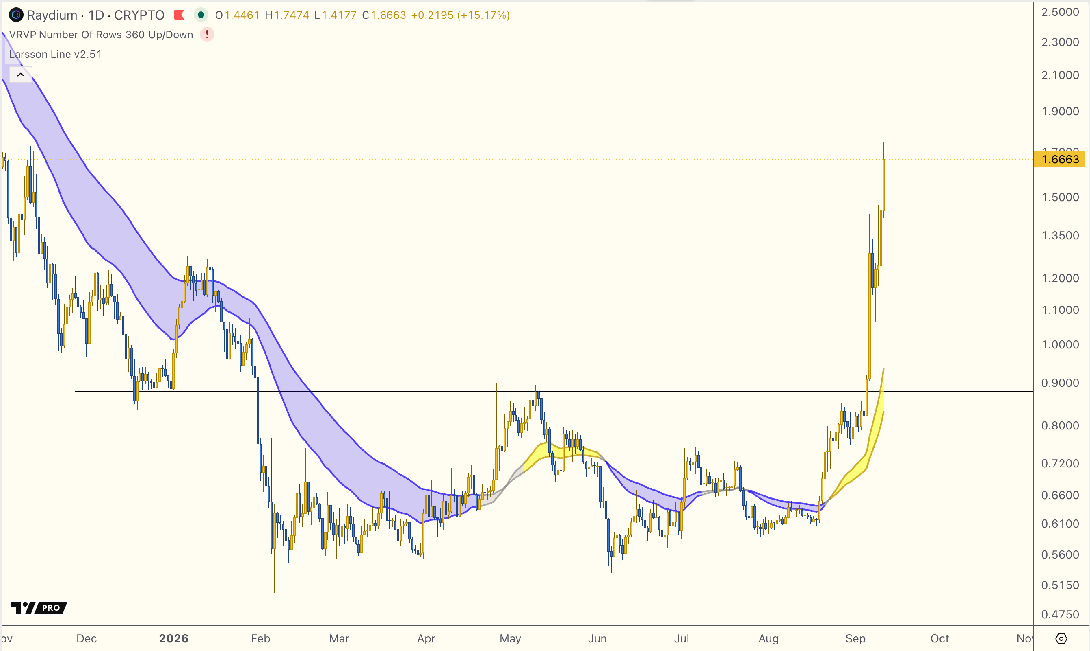
Breakdown at $0.0709 Breakdown at 88.1 s confirmed on 2026-10-29 daily close
SUI
SUI/BTC is not a great look. The key level broke. I've closed my position. Breakdown at $0.884 confirmed on 2026-10-29 daily close Position Disclosure Update: CTO LONG CLOSED
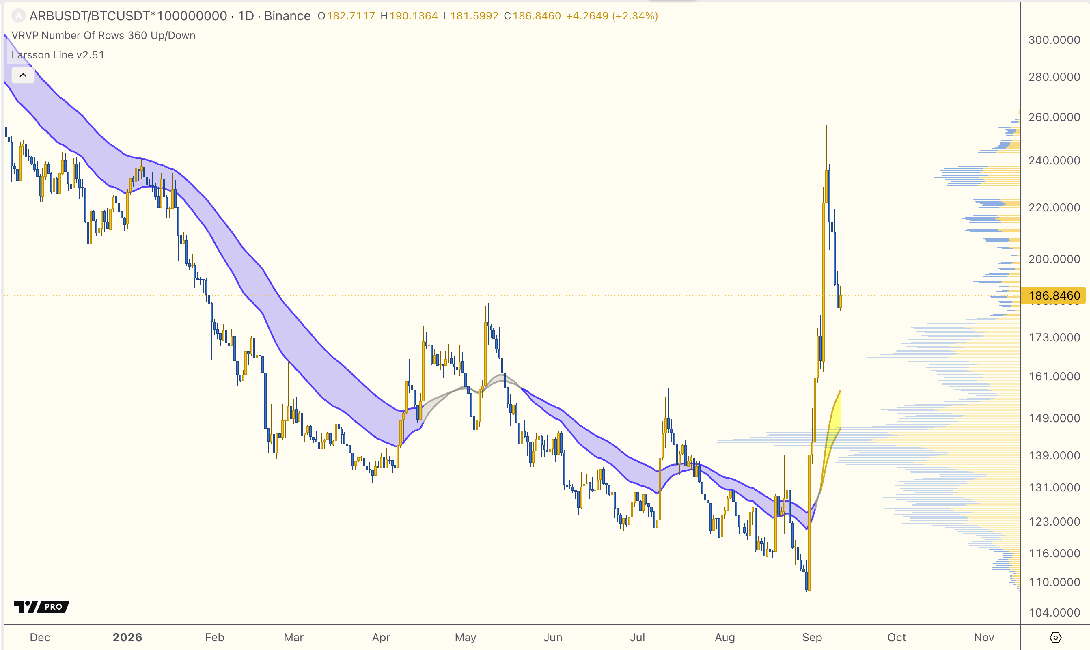
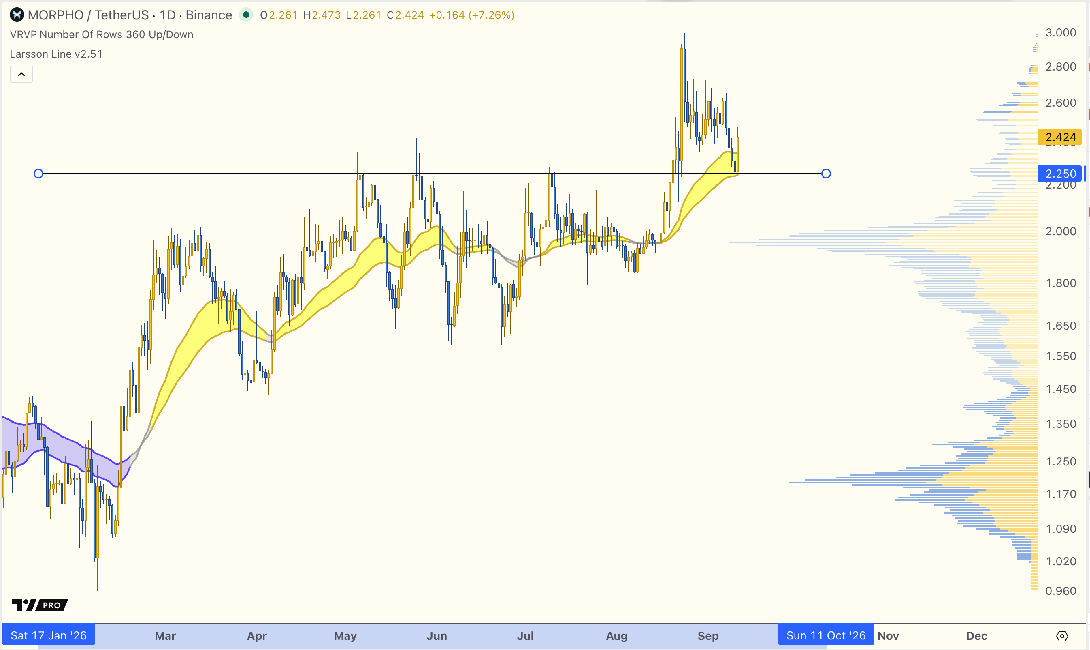
XMR
Monero The XMR charts remain strong here, both XMR/BTC and XMR/USD.
S&P 500
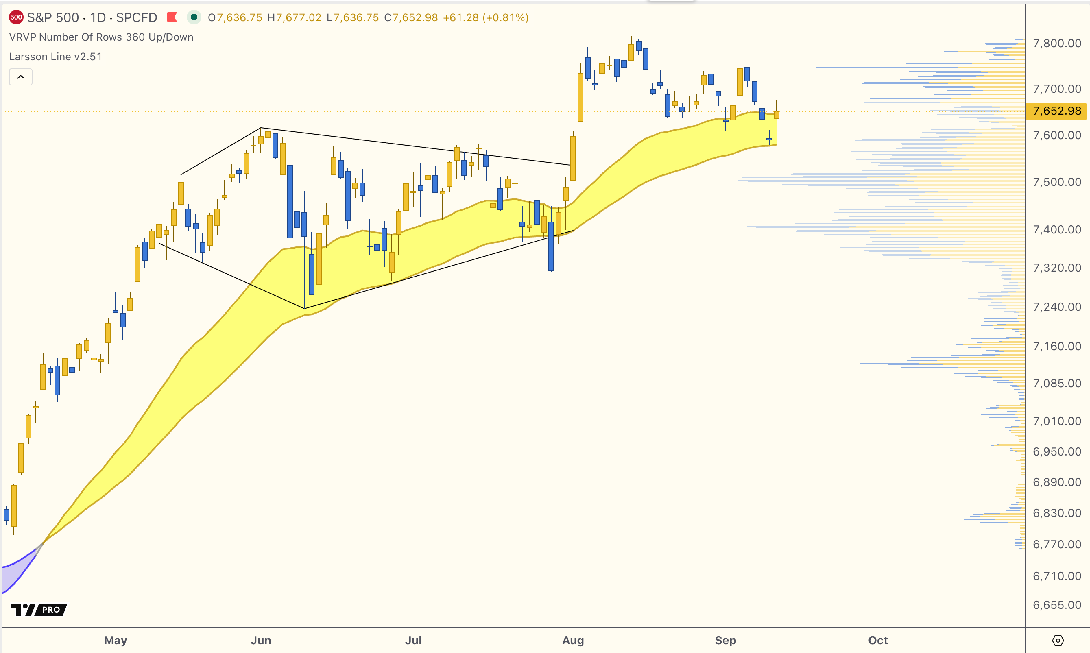
The stock market is short-term rejected at resistance, looking at this chart. Too early to say if it's just a short term consolidation or something else. I have long exposure to the US stock market in general.
NVIDIA
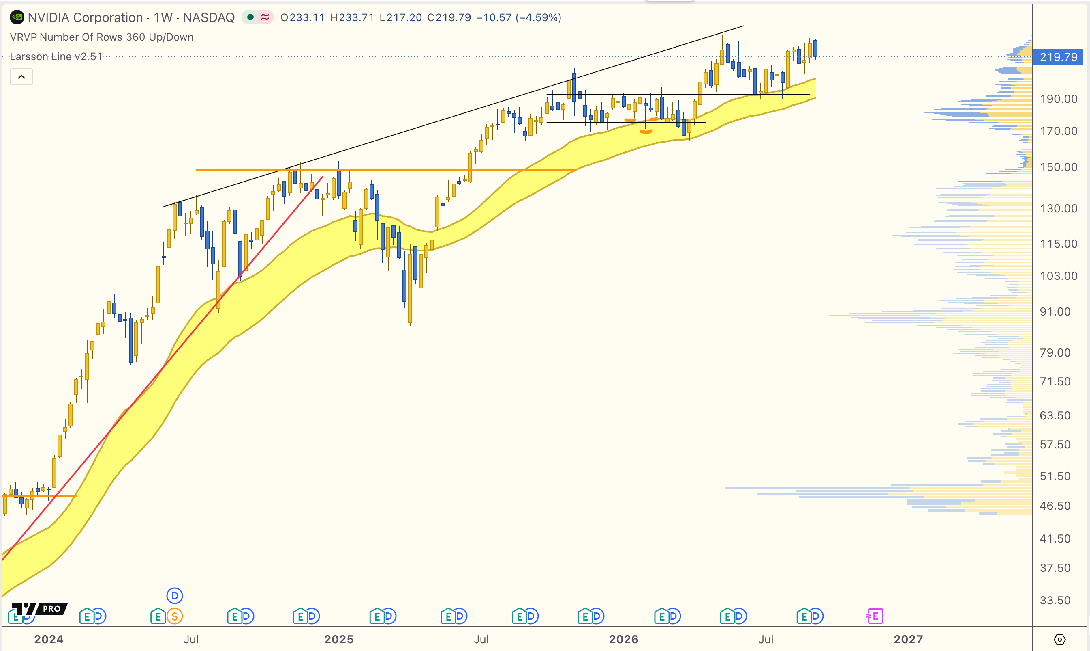
NVDA A bit worrying. This does start looking like a wedge or channel threatening to break. Hmm.. Here is the problem with diagonal patterns, you're never quite sure.
TSLA
Chart wise, TSLA continues to consolidate. Hard to say much more conclusive than that. $488 resistance remains the next hurdle to cross for TSLA.
SpaceX (SPCX)
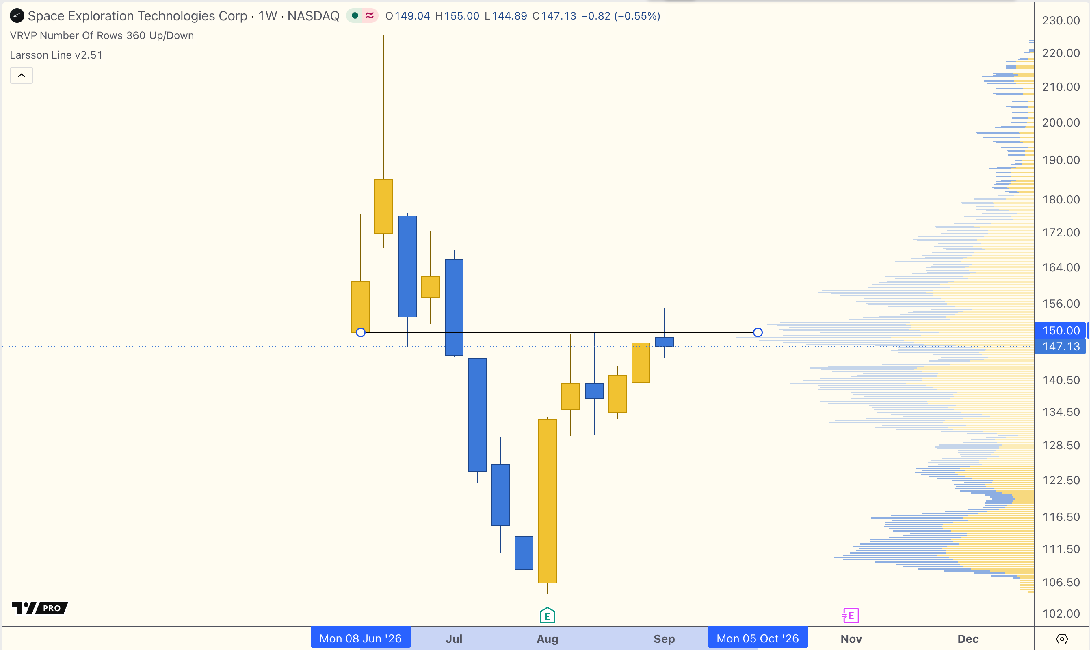
SpaceX As I shared last week, my small entry into SPCX did not go too great. This now looks very much like a rejection from the resistance zone. Not happy.
SDGR.US
Schrodinger Inc The original breakout is still holding. Breakout at $18.82 confirmed on 2026-08-21 weekly close AI-powered biotech company that licenses drug discovery software and is developing an agentic AI “co-scientist”
Okta
The original breakout is still holding: Breakout at $127.92 confirmed on 2026-07-03 weekly close Cloud identity-security platform for employees, customers and AI agents access
VEON.US
VEON Ltd The previous breakout is still holding. Breakout at 0.00913 confirmed on 2026-09-25 weekly close Provides mobile connectivity and digital services, including financial apps, across emerging markets
AVPT.US
Avepoint Inc Another breakout this week vs Index. The previous breakout is still holding (below). Breakout at $13.97 confirmed on 2026-10-09 weekly close Helps companies back up, secure and organize their cloud data
AMPL.US
Amplitude Inc The previous breakout is still holding: Breakout at $14.3 confirmed on 2026-10-09 weekly close Provides analytics software to understand how people use websites and apps
WAY.US
Waystar Holding Corp. Common Stock The previous breakout is still holding: Inverse H&S breakout at $25.92 confirmed on 2026-10-09 weekly close Provides software that helps healthcare providers manage insurance claims, billing and payment collection
VEEV.US
Veeva Systems Inc Class A Provides specialized cloud software that helps pharmaceutical companies manage drug development, regulatory compliance and sales The previous breakout is still holding: Breakout at 0.0358 confirmed on 2026-10-09 weekly close
GitLab
The previous breakout is still holding: GTLB.US / USD Breakout at $49.78 confirmed on 2026-10-09 weekly close Provides a platform for software teams with AI tools that help automate development
SECT-B.ST
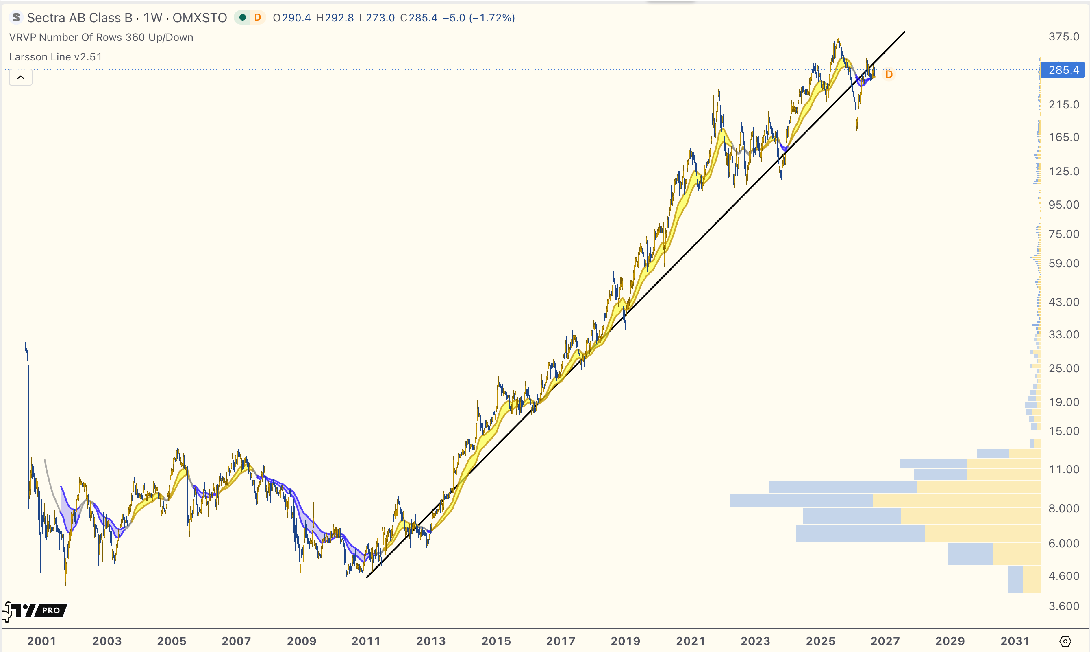
Sectra AB (publ) The previous breakout is still holding: Breakout at 312 confirmed on 2026-10-16 weekly close Swedish healthcare-technology company providing medical-imaging software with growing AI-powered radiology capabilities
NUTX.US
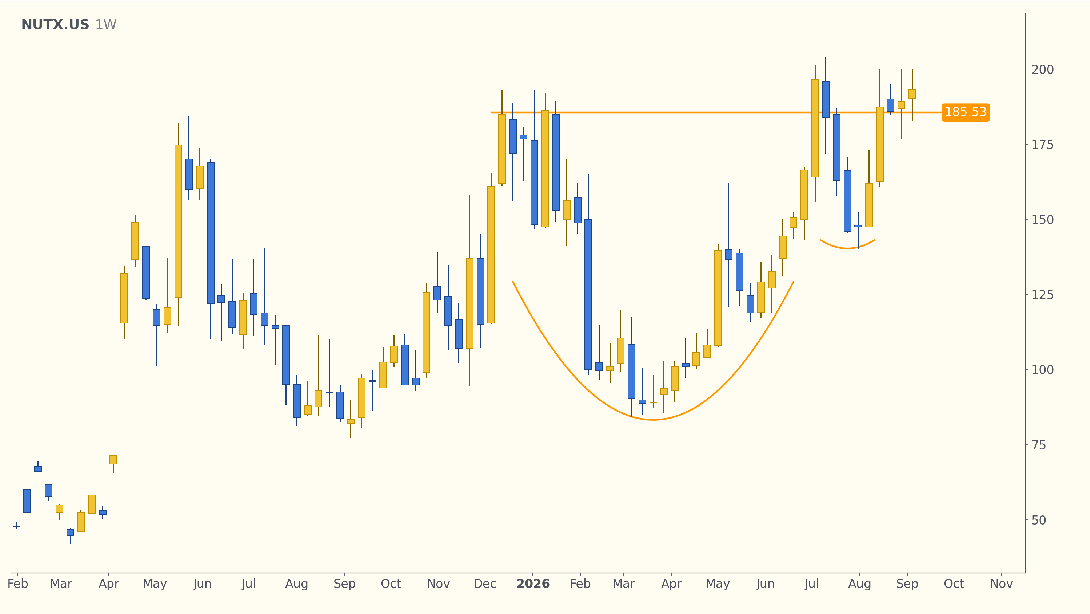
Nutex Health Inc The breakout is still holding: Cup & Handle breakout at $196.53 confirmed on 2026-09-18 weekly close
DTOL.TO
D2L Inc The previous breakout is still holding: Rectangle breakout at 9.89e-4 confirmed on 2026-10-16 weekly close Provides the Brightspace online learning platform with AI tools for creating and delivering education
MA.US
Mastercard Inc The previous breakout is still holding: Breakout at $595 confirmed on 2026-10-16 weekly close Global payments-technology company
PLUS.US
ePlus inc Another breakout this week vs Index. The previous breakout is still holding: Breakout at $93.09 confirmed on 2026-10-16 weekly close Helps businesses with IT infrastructure including cloud computing, cybersecurity and AI systems
TW.US
Tradeweb Markets Inc The previous breakout is still holding: Breakout at 0.0142 confirmed on 2026-10-16 weekly close Operates electronic marketplaces where institutional investors trade bonds, ETFs and derivatives
KO.US
The Coca-Cola Company The previous breakout is still holding: Cup & Handle breakout at 0.012 confirmed on 2026-10-16 weekly close Owns and markets a global portfolio of beverage brands, including Coca-Cola, Sprite and Fanta
SGE.LSE
Sage Group PLC The previous breakout is still holding: Breakout at 1,102 confirmed on 2026-10-16 weekly close Provides cloud accounting, payroll and business-management software with AI automation
ASST.US
Strive, Inc. The previous breakout is still holding: Breakout at $19.28 confirmed on 2026-08-28 weekly close Bitcoin-treasury company
Circle (CRCL)
CIRCLE CRCL again fell back below the $87 level. That's pretty bad. Reminder: For stocks that mostly follow the crypto market, do consider monitoring multiple timeframes in your analysis.
2409.TW
AU Optronics The previous breakout is still holding. Breakout at 1.30e-4 confirmed on 2026-09-25 weekly close Manufactures display panels and develops technologies such as MicroLED displays
CRM.US
Salesforce.com Inc The previous breakout is still holding: Breakout at $200 confirmed on 2026-08-21 weekly close Provides cloud software for managing customer relationships and is embedding AI agents that can automate sales
IOT.US
Samsara Inc Gold flip Uses connected sensors, cameras and AI to help businesses manage vehicle fleets and equipment
APPN.US
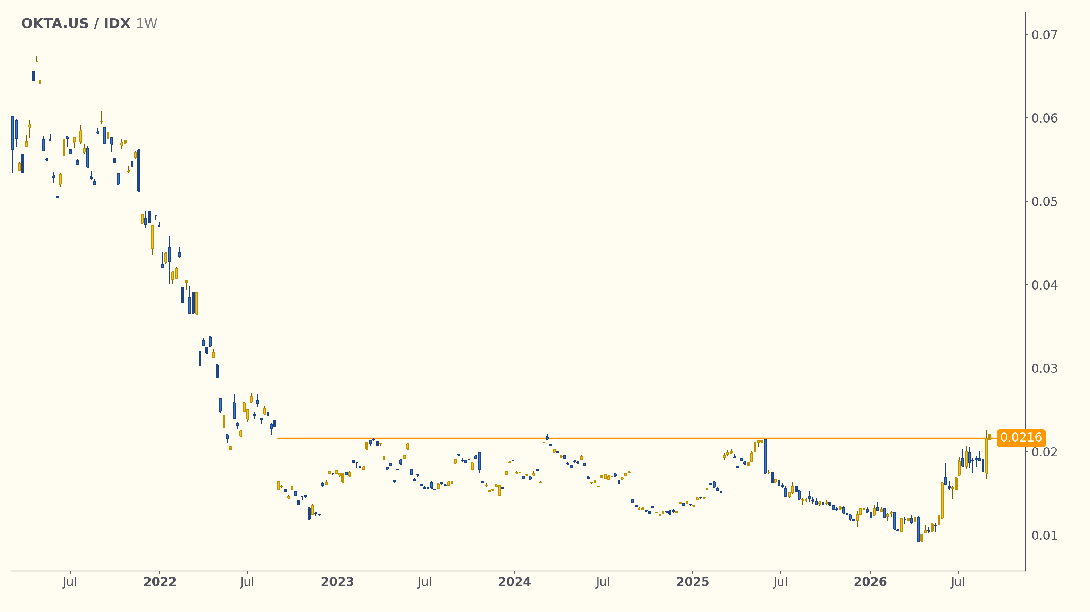
Appian Corp Breakout at $42.52 confirmed on 2026-10-23 weekly close Provides software that combines AI and automation to streamline complex business processes
GDYN.US
Grid Dynamics Holdings Inc Rectangle breakout at $8.11 Breakout at 0.00106 confirmed on 2026-10-23 weekly close Helps large companies build and implement AI systems, data platforms and cloud applications
CVLT.US
Commvault Systems Gold flip. Nearing next resistance. Provides data backup, protection and recovery software that helps organizations restore operations after cyberattacks or outages
EMR.US
Emerson Electric Company Breakout at 0.021 confirmed on 2026-10-23 weekly close Develops industrial automation equipment and software for factories and infrastructure
CART.US
Maplebear Inc. Breakout at $51.5 Breakout at 0.0067 confirmed on 2026-10-23 weekly close Operates a grocery delivery marketplace and supplies retailers with e-commerce technology and AI shopping assistants
DXY (dollar index)
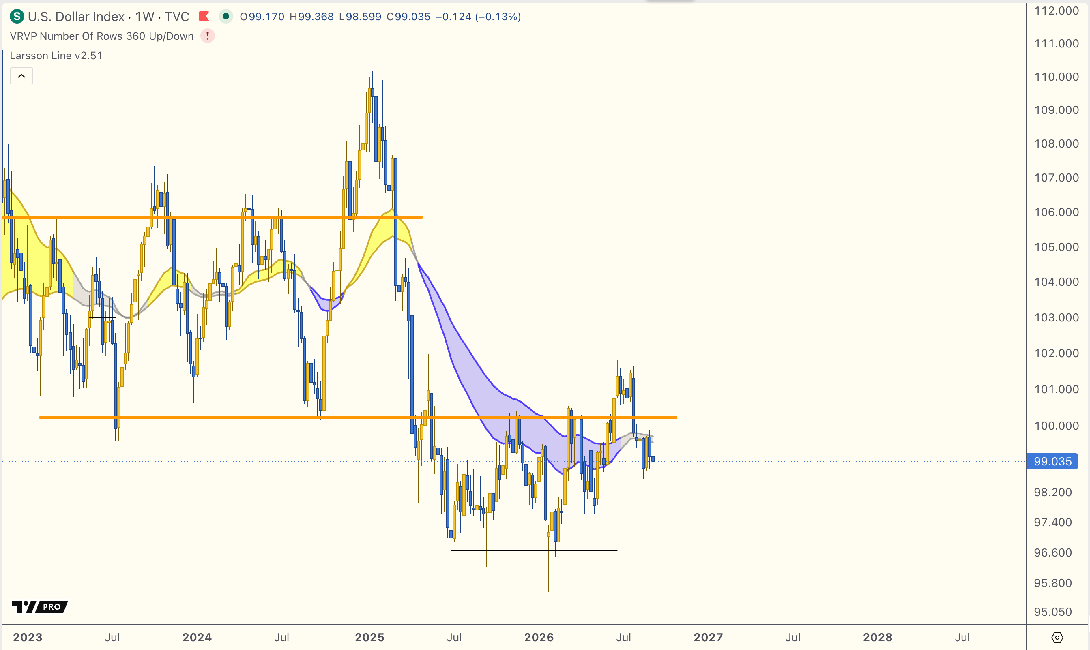
DXY DXY is confidently holding the 100 level breakout.
US 2Y Yield
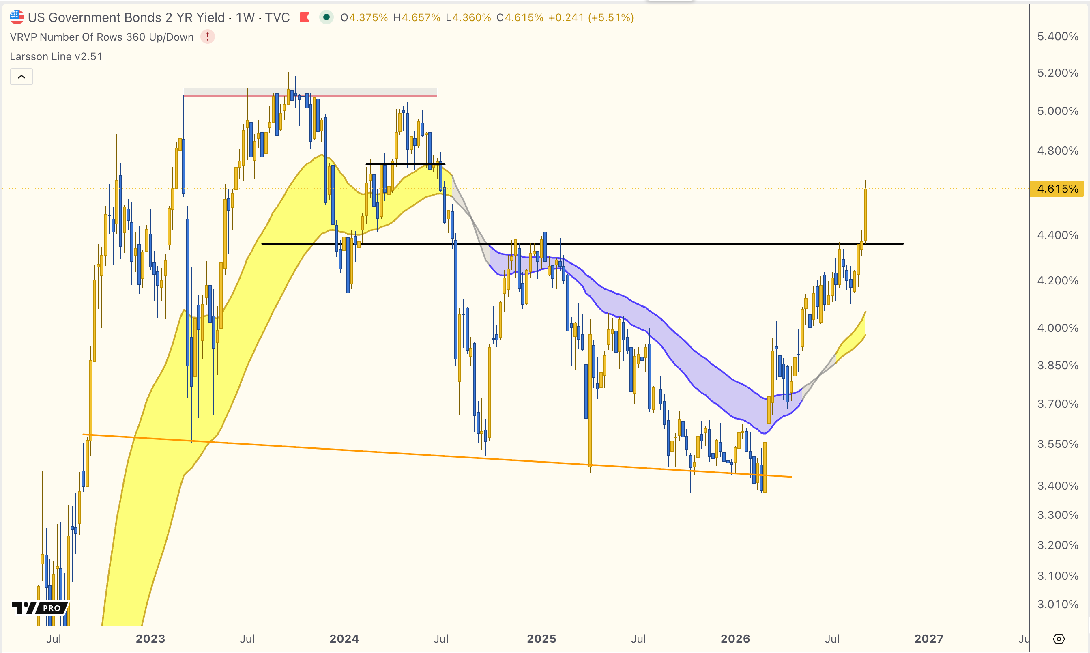
US02Y Yields Slight retracement but still on very high levels.
US 10Y Yield
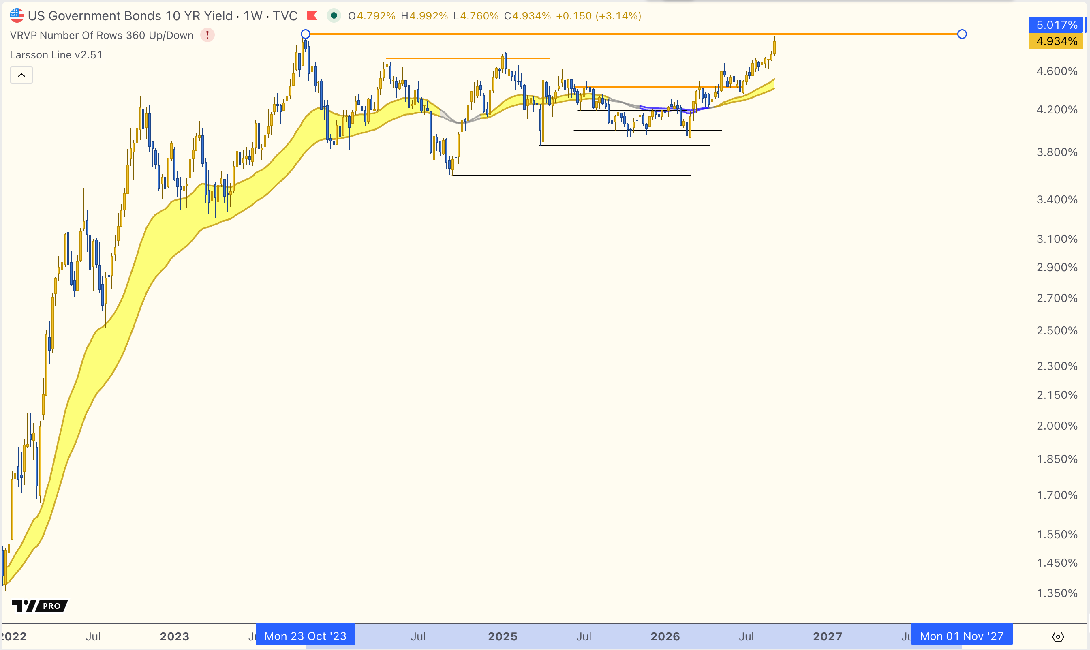
US10Y Yields Some further retracement, but still very high.
Gold
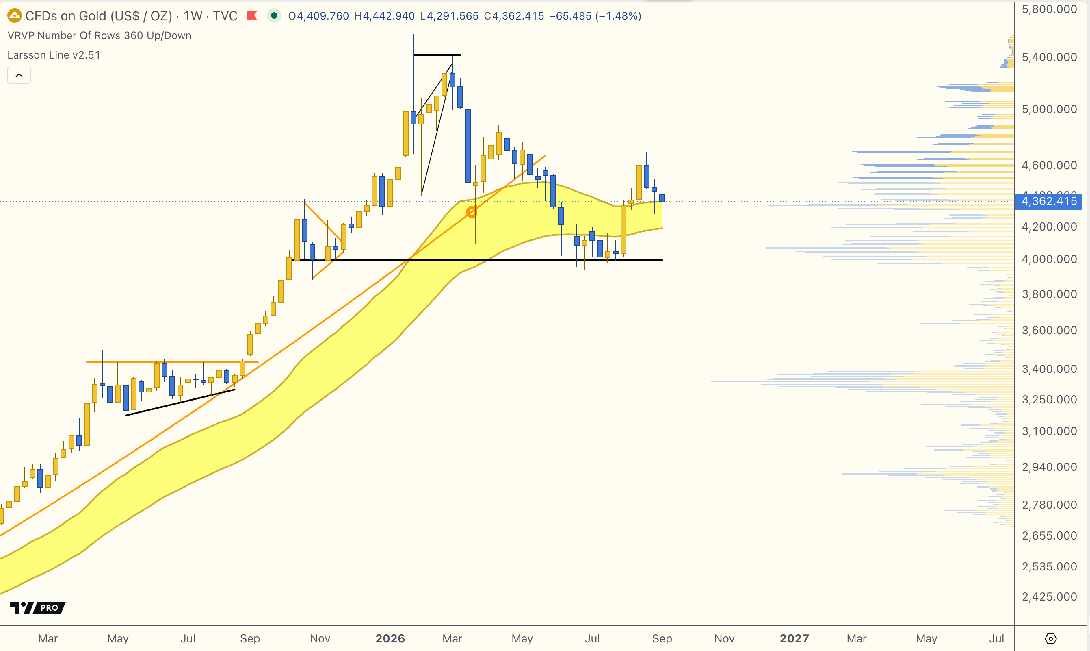
Oh this is a scary candle folks. Showing daily candles here to show you that the breakdown threatens to happen exactly right now. This price level is almost to the dollar where Gold found support and bounced back in late October 2025, almost exactly a year ago. If that doesn't hold this time, well that's not great... I have a real position here so this isn't what I wanted to see today. Can we get a bounce, pretty please?
Silver
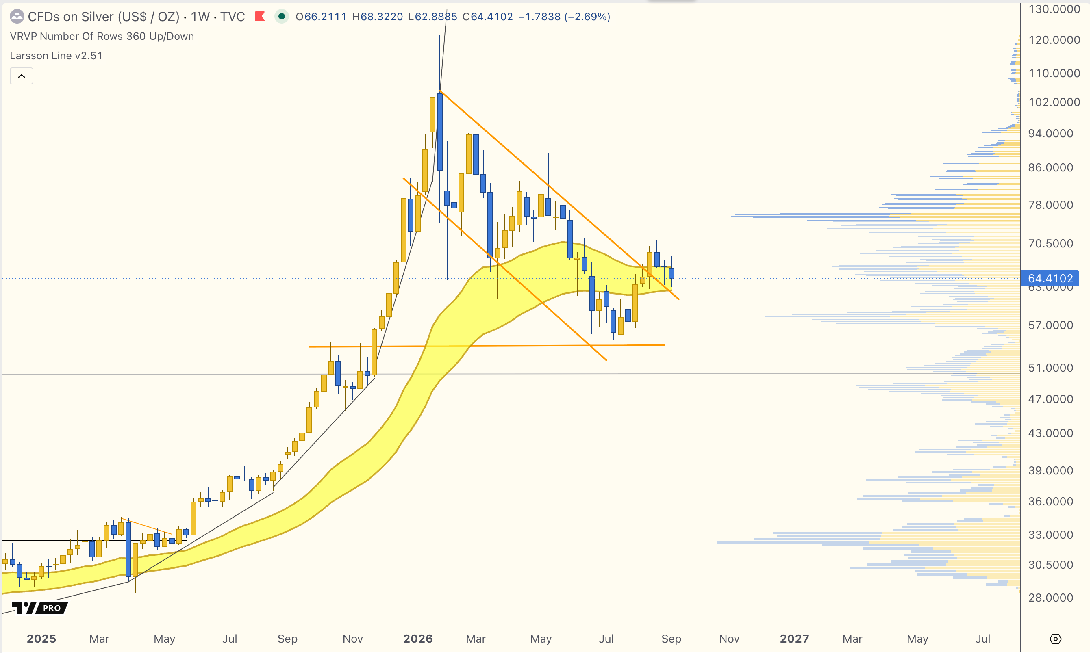
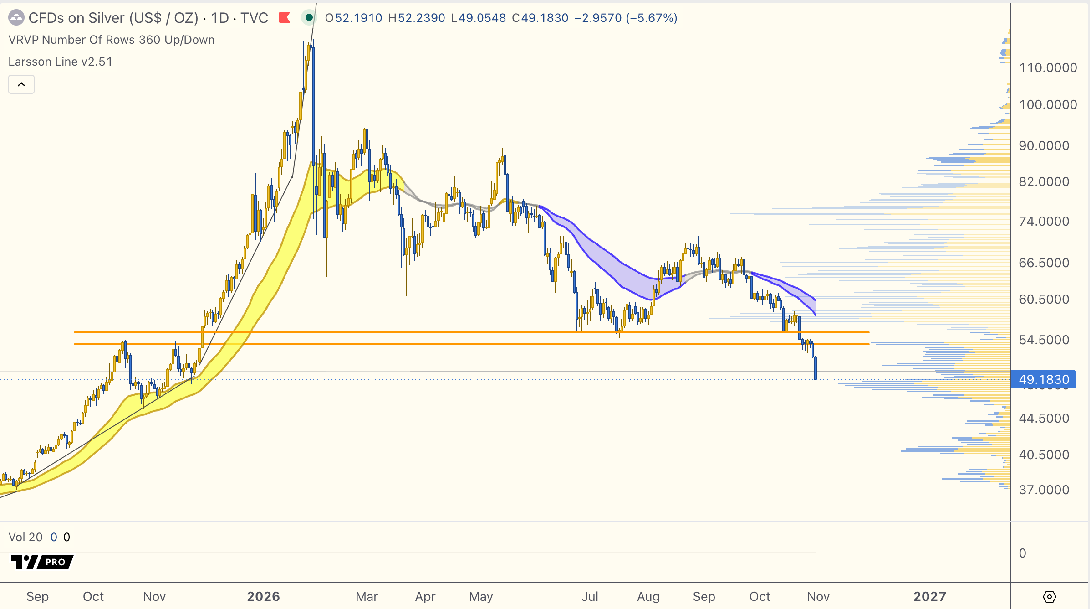
The structure in Silver is almost exactly like in Gold. This looks like a serious breakdown unless price bounces around these levels and fast. Yikes.
Oil
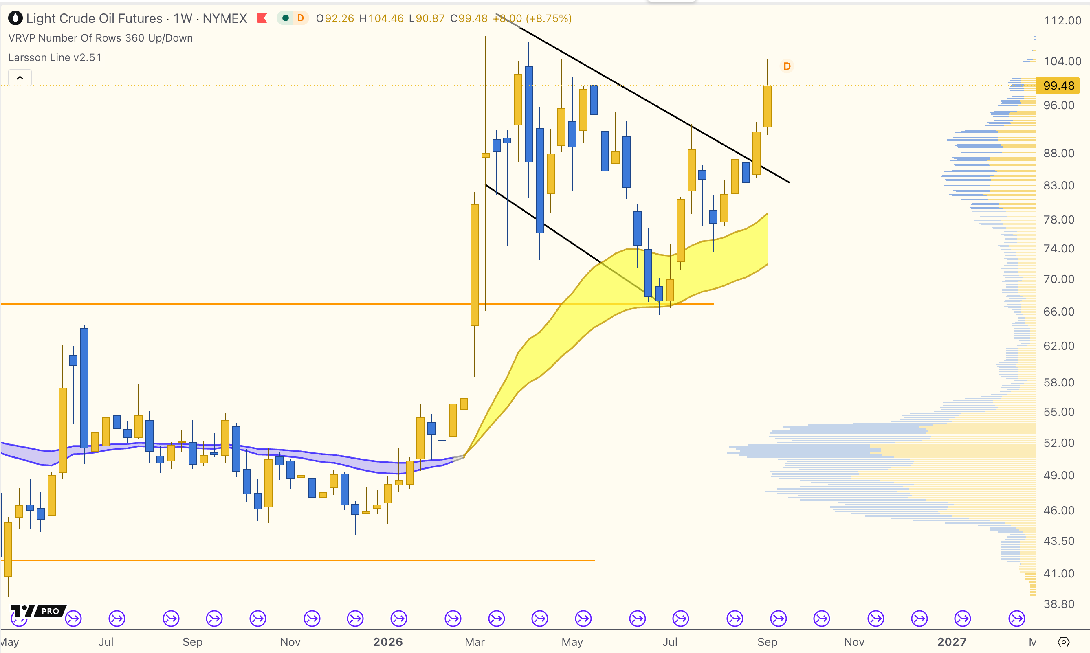
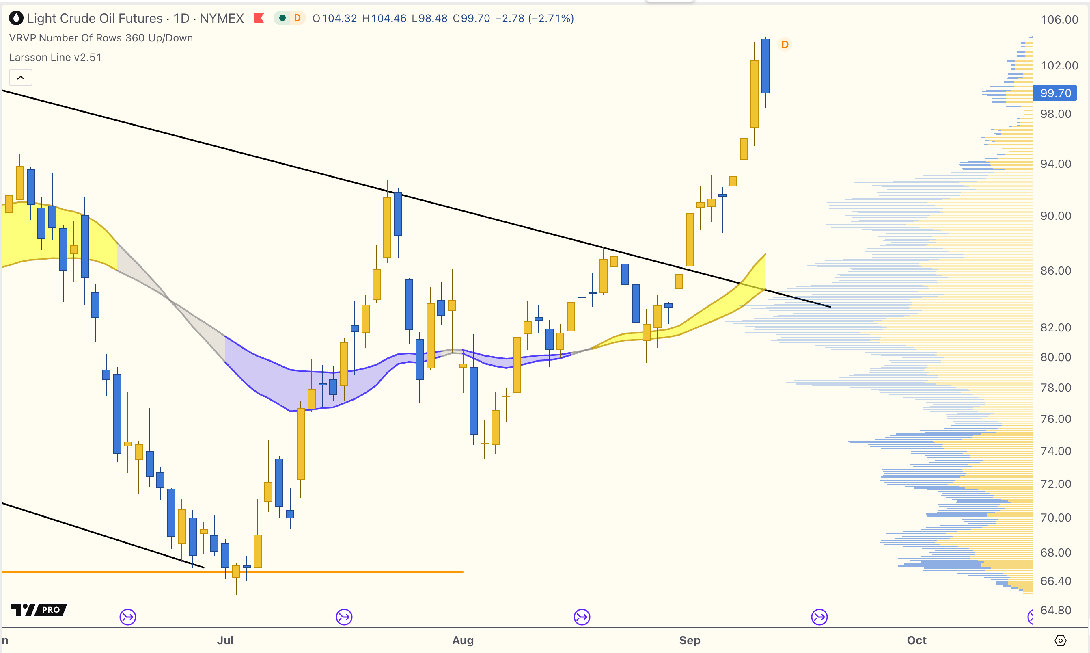
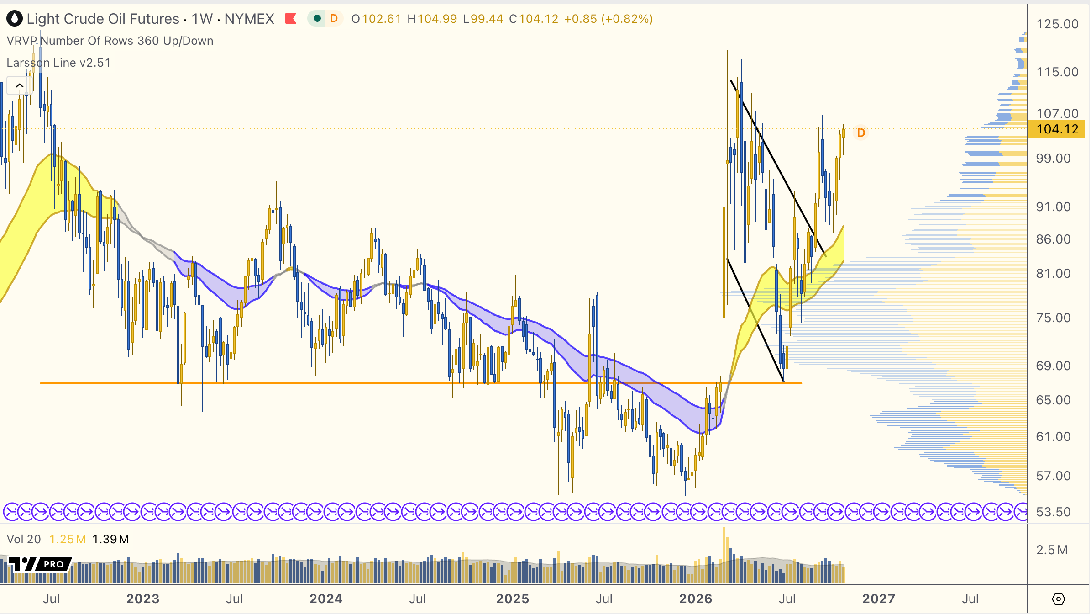
No pause in oil prices. Still bicycle to work folks 😅
Uranium
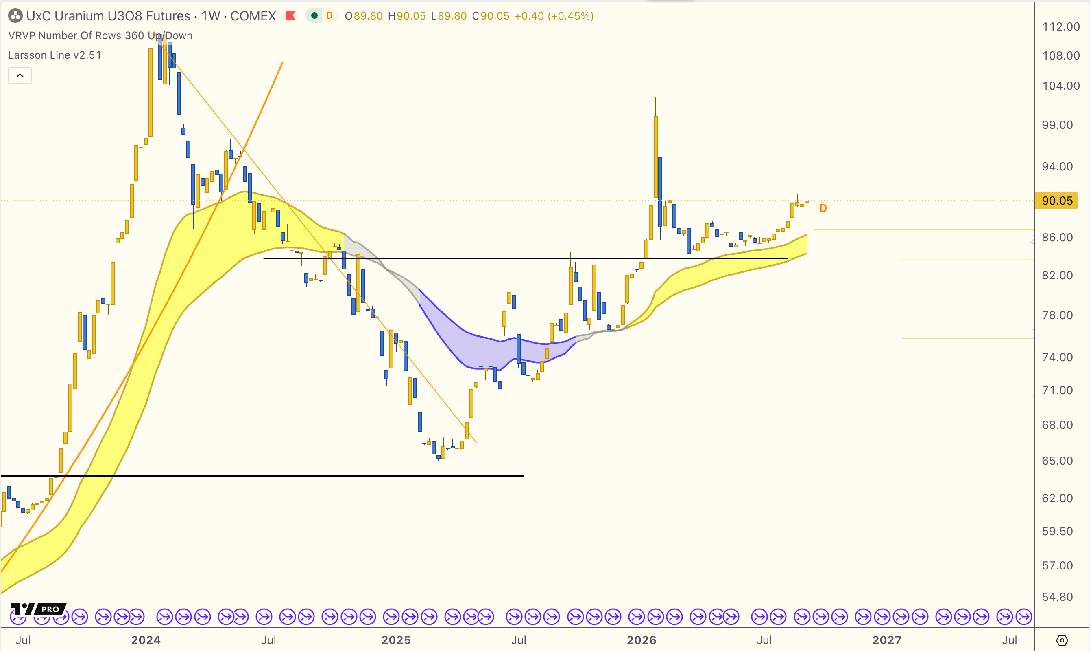
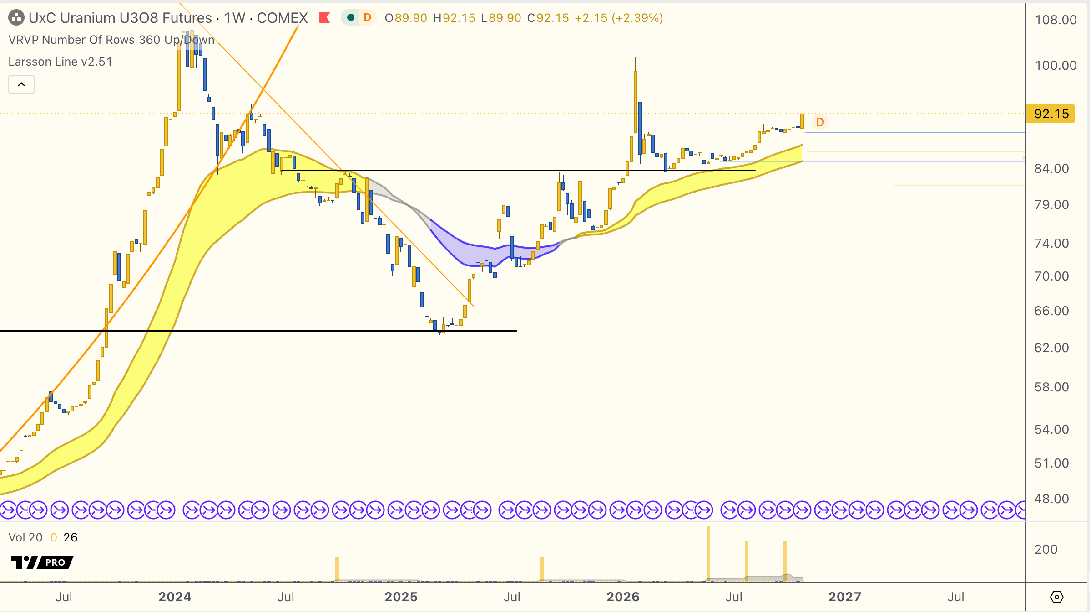
This chart shows nothing but strength here.
CHF-USD
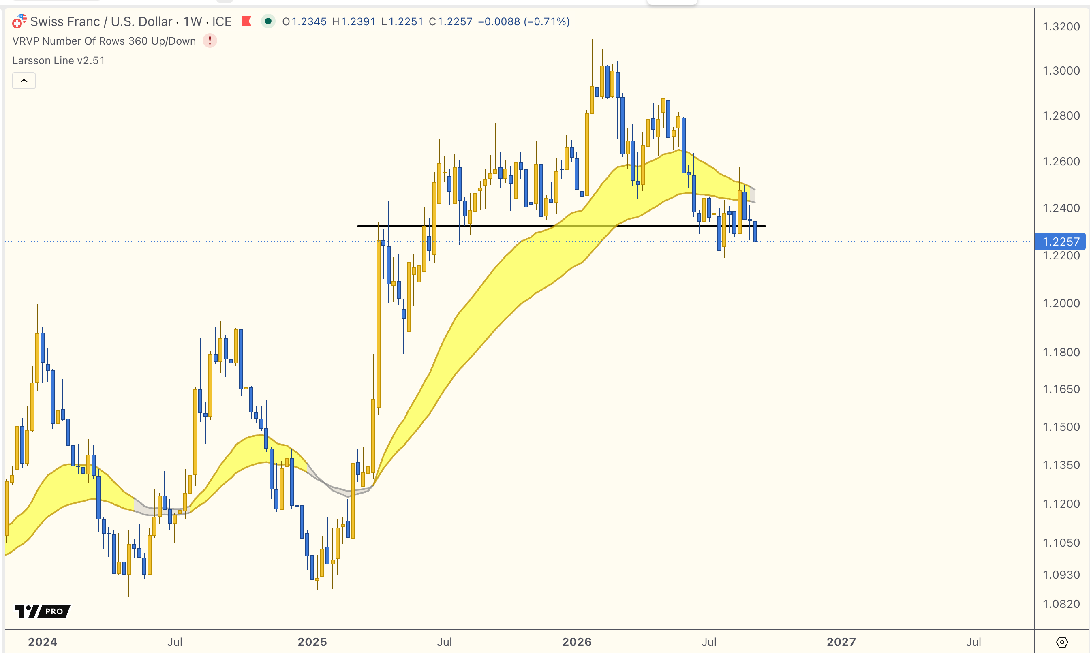
- We noted the breakdown of the 1.23-1.24 support level a few weeks ago. Still the case.
- CTO entries
- Entries marked “CTO” are written by Anders Larsson, known as CTO Larsson, Director, LK Technology Frontier Ltd.
- CTO-related positions and conflicts
- Position and conflict disclosures describe the position or conflict identified when the relevant analysis was completed and first published.
- References to CTO-related exposure include the aggregate direct or indirect economic exposure of CTO Larsson and entities controlled by him. Other material interests not adequately reflected by that exposure are disclosed separately where relevant.
- Such exposure may be held through shares, funds, exchange-traded products, crypto-assets, futures, options, other derivatives or other investment vehicles. The specific legal holder, account, custodian, custody arrangement and investment vehicle are not normally disclosed for privacy and personal-security reasons.
- CTO LONG and CTO SHORT disclose aggregate net directional economic exposure at the analysis-completion time. Where material offsetting or materially different exposures would make a simple Long or Short description misleading, the exposure is disclosed as CTO MIXED or explained separately.
- CTO CONFLICT identifies another material interest or conflict that is not adequately communicated by a Long, Short or Mixed
- another material interest. Such conflicts are not part of the ordinary core business model and would be exceptional. If one arises, additional information will be included with the disclosure.
- If no position or conflict disclosure is included in the analysis entry, no relevant CTO-related exposure or other material conflict was identified at the analysis-completion time, subject to the treatment of independently managed portfolios described below.
- These are point-in-time conflict disclosures. They do not disclose exact position size, acquisition price, legal holder, account location, custodian, custody method or investment vehicle. Positions may subsequently be entered, increased, reduced, closed
- or reversed.
- The position or conflict disclosure is included directly in the relevant CTO analysis entry. When there is no CTO analysis entry, there is generally no CTO disclosure displayed elsewhere in the tool.
- CTO LONG means that CTO Larsson and entities controlled by him had aggregate net positive economic exposure to the asset when the analysis was completed. This may include direct ownership of shares or crypto-assets, funds, exchange-traded products, derivatives or other investment vehicles. The corresponding definition applies to CTO SHORT for aggregate net negative economic exposure.
- For shares, where applicable rules require it, a net long or short position exceeding 0.5% of the issuerʼs total issued share capital, calculated in accordance with the applicable rules, will be expressly disclosed together with the direction of the position. Where that requirement applies, the absence of such a statement means that no position exceeding that threshold was identified at the analysis-completion time.
- A position change does not by itself update, confirm or reconfirm the related technical analysis.
- Independently managed portfolios
- CTO Larsson may also hold exposure to assets through portfolios managed on a fully discretionary basis by independent financial institutions. CTO Larsson does not select, direct or approve individual transactions within those mandates.
- Those portfolios may from time to time contain assets or instruments discussed in the Report. Their holdings may change without CTO Larssonʼs prior knowledge and may not be known or available on a real-time basis.
- Exposure held solely through such independently managed portfolios is not ordinarily included in the CTO LONG, CTO SHORT or CTO MIXED disclosures. A known direct holding within such a portfolio will instead be disclosed as MANAGED EXPOSURE only when, having regard to its size relative to CTO Larssonʼs aggregate investable assets, its absolute value, liquidity and other relevant circumstances, it could reasonably be expected to affect, or appear to affect, the objectivity of the analysis. This treatment does not limit any disclosure expressly required by applicable law. Holdings through broadly diversified funds are not attributed to their individual underlying constituents on a look-through basis.
- Position Disclosure Updates
- Position and conflict disclosures contained in an analysis entry record the CTO-related exposure or other material conflict identified when that analysis was completed. Those historical disclosures are not subsequently changed.
- Material subsequent changes in such CTO-related exposure may be recorded in a new timestamped entry using the heading Position Disclosure Update. These may include entering or closing a directional position, reversing its direction, changing to or from materially mixed exposure, or another change that materially affects the nature of the disclosed conflict.
- Each Position Disclosure Update refers to the CTO-related exposure to the asset identified in that entry.
- Increases or reductions that do not materially change the nature of the disclosed net exposure are not necessarily published. Multiple or partial executions forming part of the same transaction may be recorded as a single update.
- Position Disclosure Updates are normally published as soon as reasonably practicable after the relevant transaction has been completed or the resulting exposure status can be determined. The displayed UTC timestamp records when the disclosure was published and is not necessarily the precise execution time.
- Position Disclosure Updates are factual conflict disclosures only. They do not update, confirm, extend or reconfirm any related technical analysis. A new, updated or reconfirmed analytical assessment is published as a new analysis entry.
- CTO-related positions may change for reasons including portfolio rebalancing, concentration management, liquidity or cash requirements, risk management, tax considerations, execution circumstances or changing technical conditions. A position change does not necessarily indicate a change in CTO Larssonʼs technical interpretation.
- Position Disclosure Updates do not normally state the reason for a transaction. Where a new or changed technical interpretation is communicated, it is published as a new analysis entry.
- Position Disclosure Updates are generally intended to accompany CTO analysis that is still displayed as current for the asset, meaning it does not carry the warning that it is an older point-in-time analysis. Position changes may still be disclosed after that point where CTO Larsson considers it appropriate or useful for transparency, but there is no commitment to provide continuing
- position updates once the analysis is no longer current. Position Disclosure Updates exist to keep the conflict information surrounding CTO analysis transparent. They are not intended to become a separate feed of CTO trades.
- CTOʼs positions are not continuously updated indefinitely merely because an asset was analysed at some point in the past.
- Coverage, validity and historical analysis
- Planned update frequency: The Report is normally published weekly, but the assets selected vary. There is no fixed update schedule for an individual asset. Publication of an analysis does not establish continuous coverage. Additional updates may be published at CTO Larssonʼs discretion.
- Validity: Each entry is a point-in-time analysis based on the information and technical conditions available when it was completed. Unless expressly stated otherwise, it is not continuously monitored and no continuing validity is claimed. An analysis may remain technically relevant, or subsequent price action may weaken or invalidate it shortly after publication. The absence of a later update does not mean that the earlier analysis has been reviewed or reconfirmed.
- Entries more than seven days old are automatically identified as older point-in-time analyses and carry an additional warning as a reminder that market and technical conditions may have materially changed.
- New and previous analyses: Each substantive entry is a new point-in-time analysis based on the chart, prices and technical conditions existing when that entry was produced. A new entry may confirm an earlier analysis, modify it or introduce a new interpretation.
- Entries for each asset are displayed in reverse chronological order, with the newest analysis first. Where a previous entry exists, the newer entry appears immediately above it and the publication date and time in UTC of each entry is clearly displayed.
- Where a newer entry materially differs from the previous analysis, the newer chart and accompanying commentary identify the relevant developments. The immediately preceding dated entry remains displayed directly below as part of the historical record, allowing the two analyses to be compared in context and making the change clearer to the user.
- No separate composite Bullish, Bearish, Buy, Hold or Sell comparison is produced because different analytical signals may coexist or conflict and the methodology is multi-signal.
- Prices, charts and timestamps
- The asset row above the analysis displays the latest available completed daily-candle close. This value updates as new daily candles complete and may therefore be more recent than the prices shown in fixed analysis charts. It is factual market data only and does not update, extend or reconfirm an earlier analysis.
- Asset-row prices are supplied by third-party API providers and may be delayed, incomplete or erroneous. For crypto-assets and commodities, the displayed prices are consolidated from multiple trading venues by the relevant API provider. For stocks, the displayed price refers to the relevant exchange and is supplied through the API provider.
- Each analysis card displays its publication date and time in UTC in the format YYYY-MM-DD hh:mm UTC. The displayed time is when the analysis was completed and first published.
- Where a CTO-uploaded image is included, the entry also displays Chart captured: YYYY-MM-DD hh:mm UTC.
- Fixed TradingView chart screenshots preserve the chart as it appeared when captured, including the instrument or trading pair, chart timeframe, venue or data source and the live price of the current candle shown by TradingView at that time. The current candle may have been incomplete, so that price should not be interpreted as a completed daily closing price unless expressly stated otherwise. TradingView prices may also be delayed relative to the underlying trading venue or contain errors.
- The LLP system may also generate charts, identifiable by the absence of TradingView branding. These charts display completed candles only as of the time the chart was generated: currently completed daily candles for crypto-assets and completed weekly candles for stocks and commodities.
- The ticker appears in the asset row and analysis entry. The complete asset or instrument name and additional identifying information are available by hovering over or selecting the asset. Futures and other derivatives are identified by their relevant contract characteristics where applicable.
- Where an analysis materially relies on information that is not apparent from the displayed chart or market data, the material source is identified in the analysis entry, for example an earnings release.
- About the Report
- My purpose with the Report is to help you calibrate your own analysis, not to replace it.
- The Report contains general and impersonal technical analysis of shares and other financial instruments, commodities and crypto-assets. It is not prepared for any particular recipient and is not tailored to any recipientʼs financial circumstances, investment objectives, experience, knowledge, tax circumstances, risk tolerance or ability to bear losses.
- The Report does not provide personalised investment advice. No asset or transaction is presented as suitable for a particular recipient. Recipients must make their own decisions and, where appropriate, obtain advice from an appropriately authorised adviser.
- LK Technology Frontier Ltd does not execute or transmit customer orders, manage customer portfolios, hold customer assets or provide copy-trading services.
- How the analysis is prepared
- The Report interprets current market data using the Larsson Line Pro toolset and established principles of technical analysis. Depending on the asset, relevant factors may include trend, momentum, price structure, chart patterns, support and resistance, trading volume, volatility and identified confirmation or invalidation conditions.
- The Report does not use Buy/Hold/Sell ratings or trading calls.
- Technical analysis is inherently uncertain. Patterns and signals may fail, prices may gap through identified levels, and changing market, issuer, liquidity, political, regulatory or macroeconomic circumstances may invalidate an analysis without warning.
- No ratings or price targets
- The Report does not use a standard Buy, Hold or Sell rating system and does not force each analysis into a single directional conclusion. An analysis may be observational, conditional or inconclusive.
- Larsson Line Pro does not normally use price targets. Where a target, projection or forecast is exceptionally stated, it will be clearly identified as such and any material assumptions specific to it will be stated. References to recognised chart patterns or technical-analysis frameworks do not normally restate their standard textbook methodology.
- Timeframes and analytical horizon
- The chart timeframe is displayed within the applicable chart.
- Unless otherwise stated:
- Daily-chart analysis generally concerns developments over days to several weeks or months.
- Do not invest money you cannot afford to lose in high-risk assets.