Last week in BVL064, Bitcoin was playing the waiting game.
This week, the first major catalyst broke the stalemate, but not in the direction bulls were hoping for. The CLARITY Act failed to advance in the Senate, removing one of the catalysts supporting expectations for another push higher.
Now the market barely has time to digest the disappointment.
Wednesday's FOMC decision puts another major catalyst immediately ahead, leaving Bitcoin caught between the aftermath of the CLARITY Act and a macro event capable of bringing volatility back to the market. With price already under pressure, Bitcoin enters the FOMC with the market positioning for what comes next.
Beneath the volatility, the structure Bitcoin spent months rebuilding is still there. And after following the transition from the summer lows, we may finally be reaching the point where that new structure gets tested.
The waiting game is ending. Now Bitcoin has to show us what it built.
Top-Level Summary
16 September 2026 (Current Price: $76k)
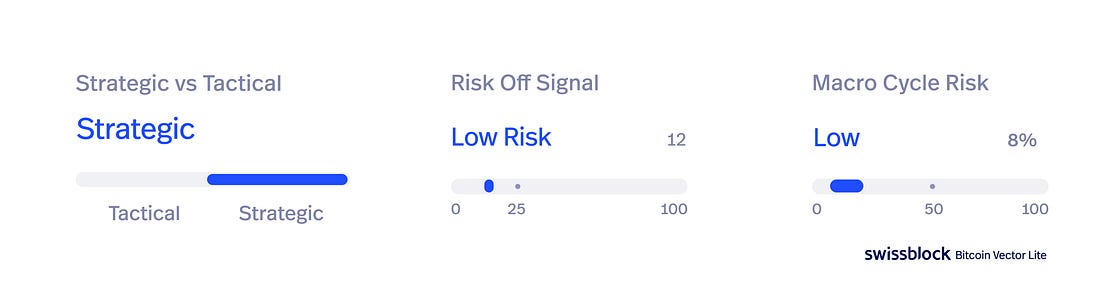
- Bitcoin's consolidation is facing its first test, as downside volatility returns while the broader cycle structure remains firmly intact.
- Short term (1-2 wks): Bitcoin has retreated toward the $75k–$76.6k structural zone as Microstructure continues leaning lower and Flow remains weak. ETF demand is beginning to improve and Urgency is shifting toward buyers as sellers lose strength. Confidence: High
- Medium term (up to 6 wks): the post-breakout reconstruction remains intact, but the rising STH Cost Basis around $71.5k represents the deeper structural test if current support fails. Holding it alongside renewed Flow would reinforce the emerging floor. Confidence: Medium-High
- Macro Cycle: MCR has remained compressed in single-digit territory for more than a month, while fundamentals have materially improved from their bear-market lows. The evidence increasingly points toward the early innings of a new bull cycle, although that does not imply a straight-line expansion from here. Corrections and structural retests remain part of building the new cycle. Confidence: High
Price Targets
- Buy the dip (for hodlers): ~$74.7k short liq · ~$73.9k short liq · ~$72.1k long liq · ~$71.5k long liq (STH Cost Basis)
- Bulls: ~$76.9k short liq (30D Cost Basis) · ~$77.4k short liq (7D Cost Basis) · ~$80.6k short liq · ~$82.2k short liq (All ETFs Cost Basis)
Structure at a glance
Short Term View
Sometimes all gravity needs is a little push.
Bitcoin has slipped toward $75k after another attempt at $80k turned into a bull trap at the beginning of the week. The failed CLARITY Act vote provided the latest push, while expectations around Wednesday's FOMC decision are keeping the market in suspense.
The reaction has been negative, but structurally, little has changed.
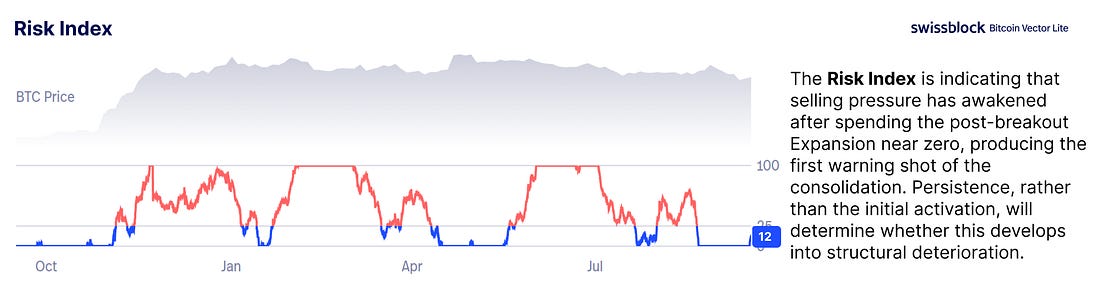
Bitcoin remains inside the post-breakout consolidation, now interacting with the $75k–$76k region. The market is being tested, but the reconstructed structure has not broken.
Microstructure continues leaning lower, and Flow has yet to provide the persistent demand needed to reverse the slowdown. With the FOMC still ahead, an improvement may have to wait until the market absorbs this week's macro uncertainty.
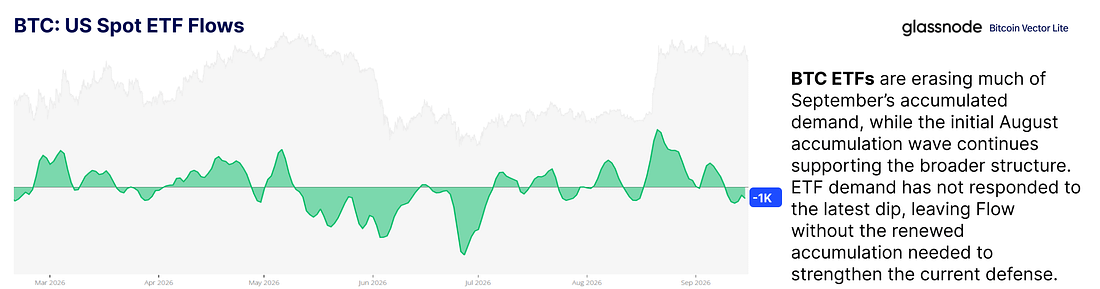
There are, however, early signs worth watching. ETF demand is beginning to turn higher after an inconsistent September, potentially setting the stage for a change in the Flow picture. For now, the response needs persistence before it can be considered a renewed accumulation wave.
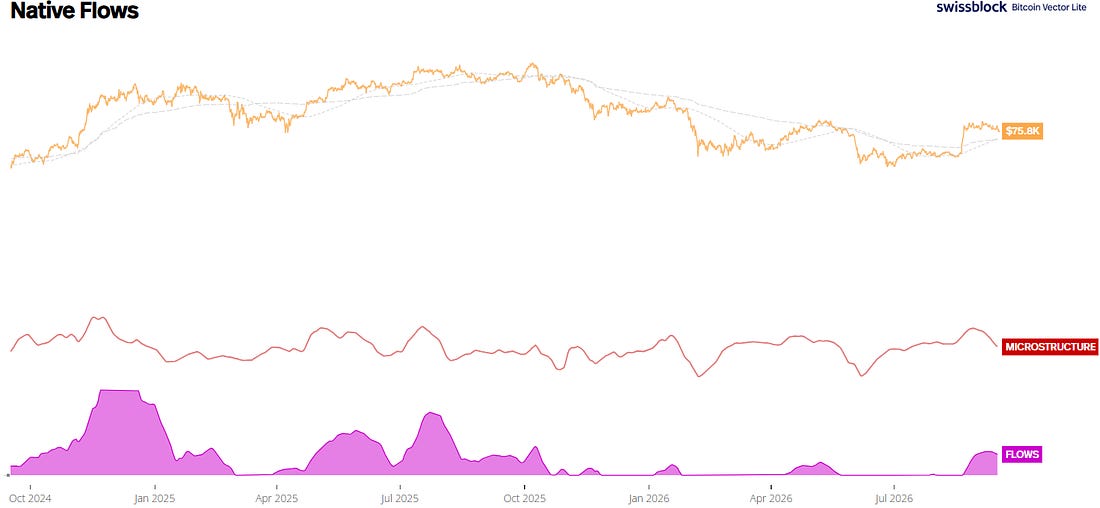
If that response does not arrive, the rising STH Cost Basis around $71.5k becomes the next structural test. Holding the level alongside renewed Flow would provide stronger evidence that recent investors are willing to defend the new Cost Basis established after the breakout. Losing it while Flow remains weak and selling pressure expands would materially weaken the reconstruction and bring the $60ks back into the picture.
Tactically, the cooldown suggests Bitcoin could remain choppy for a while longer. VWAP has almost returned to its baseline after the extreme conditions created by the breakout, while Speculation indicates that paper positioning remains weak in the short term.
Urgency is turning upward in favor of buyers as selling urgency fades, suggesting sellers may be approaching exhaustion. Buyers have not fully taken control yet, but the balance is beginning to shift in their direction.
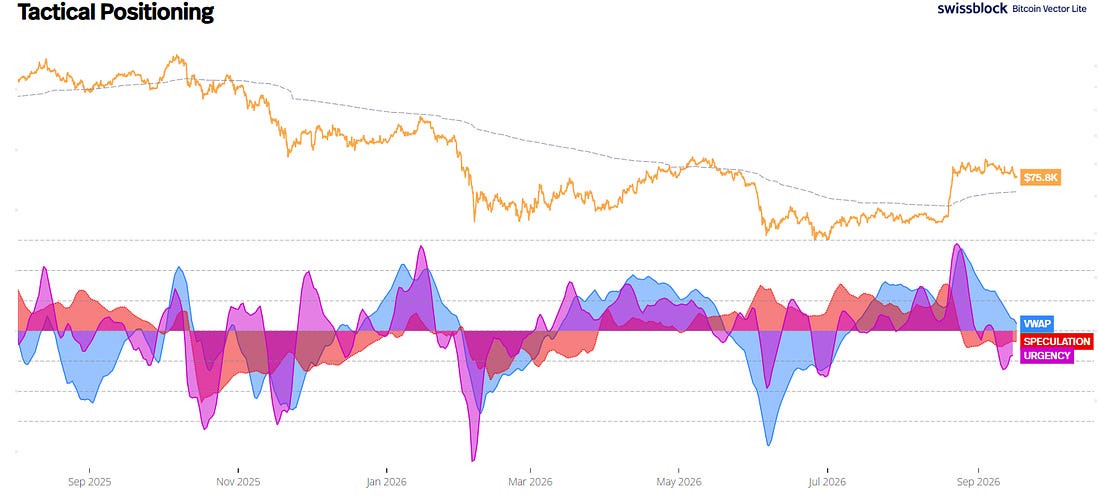
For now, Bitcoin remains in the middle of the test: Flow needs to recover, $71.5k remains the deeper line of defense, and the FOMC could provide the catalyst that breaks the stalemate.
Altcoin Flows
Top capital flows (in order):
- BTC: Flow remains weak, but Bitcoin may be approaching the final stretch of the recent outflow cycle. With CLARITY Act uncertainty fading and the FOMC still ahead, liquidity expectations could shift quickly. For now, confirmation is preferable to anticipating the turn, particularly while ETF demand is only beginning to recover.
- ETH & SOL: ETH Flow has rebounded and is regaining leadership, providing a more constructive signal after recent weakness. SOL is moving in the opposite direction, with Flow continuing to deteriorate. The divergence puts ETH back in the strongest position among the majors, while SOL still needs demand to stabilize.
Altcoin volatility has intensified alongside Bitcoin's downside move. Alts continue displaying greater sensitivity in both directions and could respond more aggressively to further BTC swings.
Altcoin flows shown here are not intended to assist trading in altcoins. The flows between alts and BTC are used to infer clues about the macro structure of BTC.
Macro Cycle View
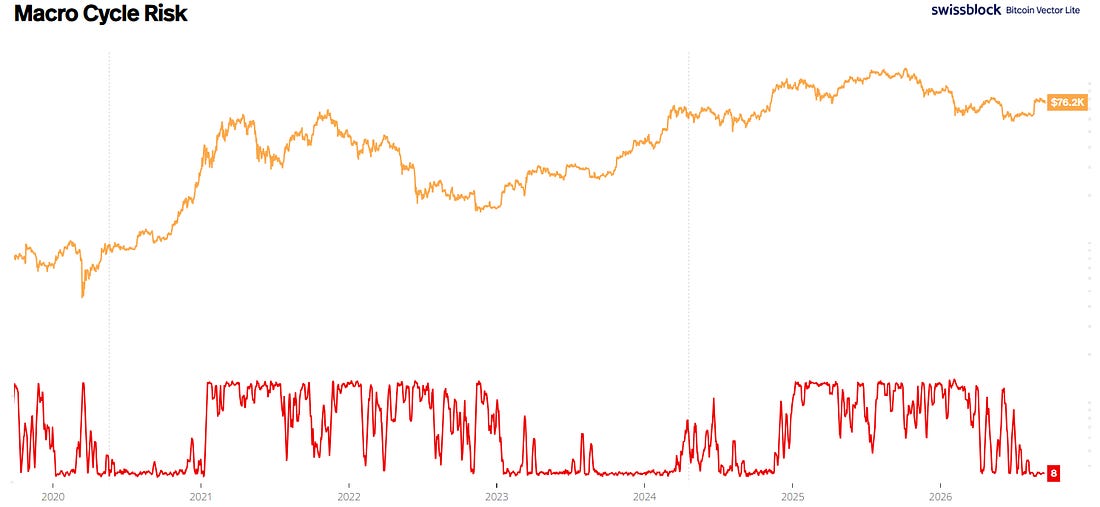
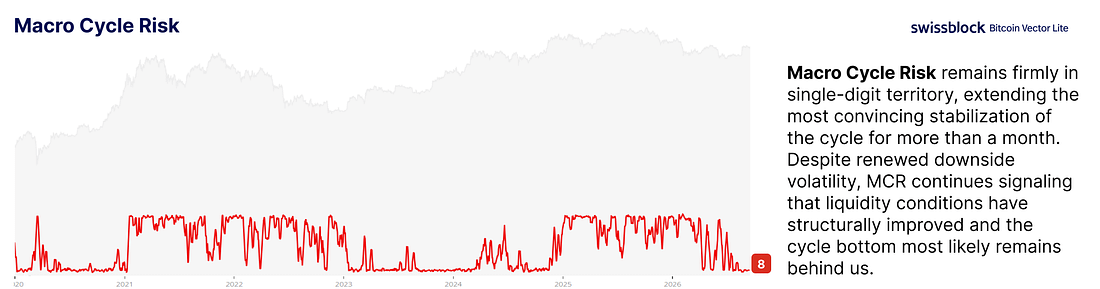
Although short-term uncertainty has increased and downside volatility has returned, Macro Cycle Risk continues providing firm confirmation that the return of liquidity most likely means the cycle bottom is already behind us.
We are still in the early innings of a new bull cycle, where Bitcoin is beginning to build its new structure. Short-term fluctuations have done little to challenge what Macro Cycle Risk has been signaling for more than a month.
Since Bitcoin marked its cycle low in June, MCR has consistently formed lower highs, gradually compressing until reaching the single-digit regime we had been waiting for. More importantly, it has remained there despite the choppy consolidation, and latest increase in downside volatility.
There is one structural piece still worth testing.
The Short-Term Holder Cost Basis has stalled around $71.5k, no longer climbing at the same pace seen immediately after the breakout. A retest of this zone could provide important evidence that Bitcoin is establishing a new structural floor during these early stages of the cycle.
Back in BVL051, we wrote that "Bitcoin has entered the final phase of the bear market." The framework has evolved considerably since then. Today, the evidence allows us to move that narrative forward: Bitcoin is likely to be in the early innings of a new bull cycle.
That does not mean upside expansion becomes a straight line from here. Corrections, consolidation, and structural retests remain part of the process.
Bitcoin Vector Lite Analytics
Swissblock Chart of the Week
Back in BVL053, we highlighted an important divergence: Bitcoin's fundamentals were beginning to recover while price was still searching for a bottom.
Three months later, we can see what happened next.
At the time, the Bitcoin Fundamental Index had rebuilt from its February lows but remained below the 40 threshold, signaling that the underlying structure was improving without yet confirming a broader recovery. Price subsequently fell toward its June cycle low, but BFI did not follow it lower. Instead, fundamentals held up.
That divergence became particularly important around the June bottom. While Bitcoin made a considerably lower price low, BFI remained above its February trough, providing another indication that the deterioration beneath the surface was losing intensity.
What followed is the confirmation. BFI finally broke above 40 in late July and briefly moved above 60 during the August breakout, shifting fundamentals from Weak through Neutral and into Strength. Since then, the index has cooled alongside Bitcoin, but importantly, it has remained around the 50 area and firmly above the Weak zone.
That changes the interpretation of the current correction.
Bitcoin is no longer falling against deteriorating fundamentals as it did during the bear market. Price is testing its post-breakout structure while the fundamental backdrop remains considerably healthier than it was around the cycle lows.
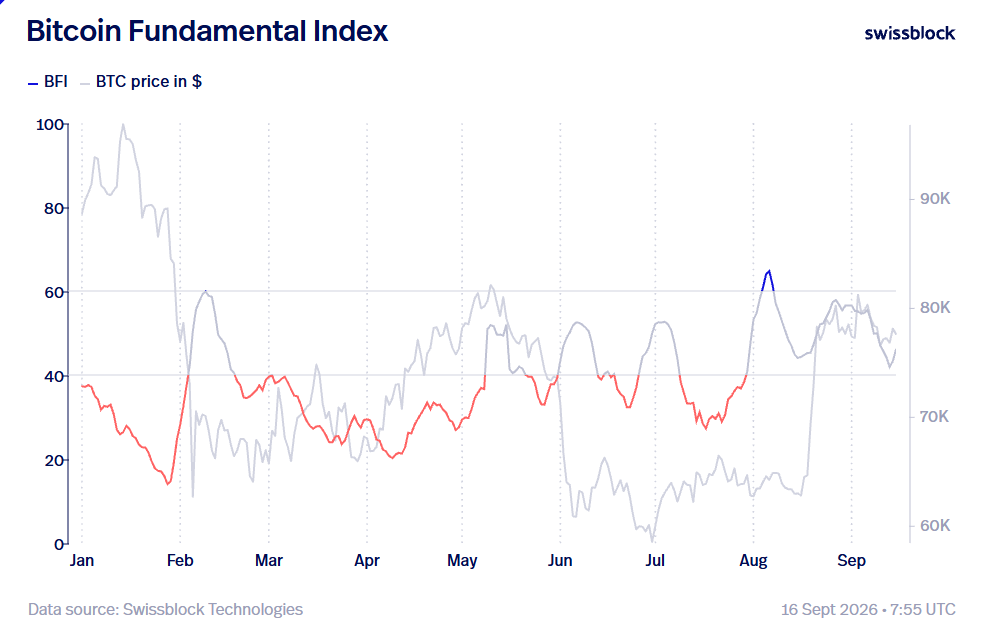
Price eventually did. Now the question is whether that fundamental strength can remain beneath the surface while Bitcoin builds the next stage of the cycle.